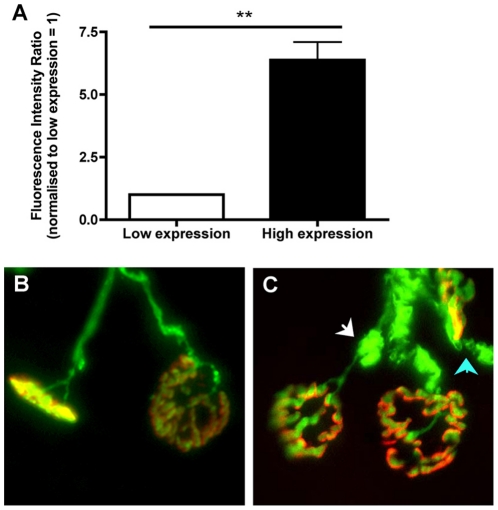
Figure 3. Increased incidence of morphological abnormalities at the NMJ in tissue banked from a strongly-expressing YFP-16 mouse colony.
A - Bar chart (mean ± s.e.m.) showing relative expression levels of YFP in the sciatic nerve of YFP-16 mice from the current Edinburgh colony (low expression), compared to YFP levels in tissue banked from a now defunct high-expressing YFP-16 colony previously held at the University of Leeds, quantified using fluorescent western blot (** P<0.01 unpaired two-tailed t test). B–C - Representative micrographs showing NMJ morphology in low-expressing YFP-16 mice (B) compared to high-expressing YFP mice (C). Motor endplates are labelled and shown in red. Note the presence of large YFP accumulations in both axons (white arrow) and motor nerve terminals (blue) from the high-expressing tissue. Such morphological abnormalities were present in all preparations examined from high-expressing YFP mice.

