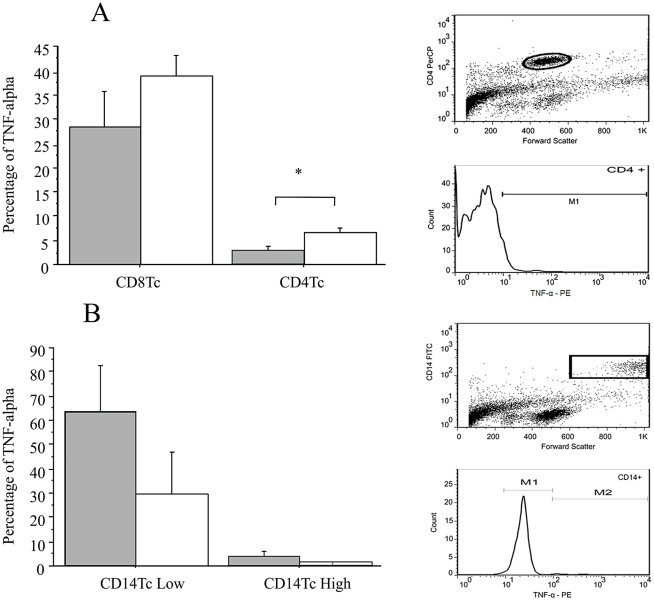
Figure 4. TNF-alpha expression on CD8+ and CD4+ lymphocytes.
A. Percentage of TNF-alpha-producing cells among the CD8+ and CD4+ population of patients with the cardiac (gray bars) and indeterminate form (white bars) after 48 h of culture in the presence of T. cruzi antigens. B. Percentage of TNF-alpha-producing cells among the CD14+ population of patients with the cardiac (gray bars) and indeterminate form (white bars) after 48 h of culture in the presence of T. cruzi antigens. For analysis, a gate was established using FSC and surface marker flowed by analysis of intracellular TNF-alpha expression.

