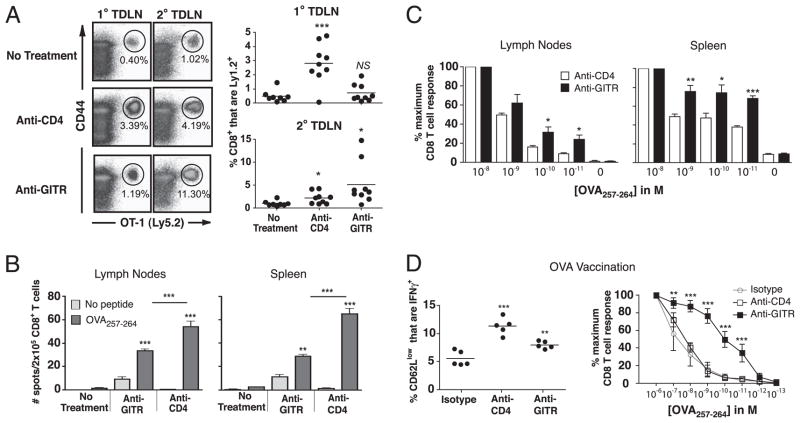
FIGURE 7.
GITR stimulation induces high-avidity T cell responses to a tumor-specific Ag. A, Mice received 106 Ly5.2+ OT-1 T cells on day −1 and primary B16-OVA on days 0 and 6 either alone (no treatment) or with anti-CD4 or anti-GITR on days 4 and 10. Flow cytometry was performed on day 12 to detect OT-1 cells. Left, Representative data from one mouse in each treatment group; gated on live CD8+ T cells. Right, Summary of data; y-axis represents percentages of Ly5.2+ OT-1 cells among total CD8+ T cells in live lymphocyte gate. Symbols represent individual mice, horizontal lines represent averages, and asterisks represent statistical significance relative to untreated control. Data represent two combined experiments. B and C, Mice were inoculated with B16-OVA tumors on days 0 and 6 and were left untreated or were treated with anti-GITR or anti-CD4 on days 4 and 10. On day 15, IFN-γ ELISPOT was performed on purified CD8 T cells from pooled spleens (six mice per group). EL4 cells pulsed with no peptide or with OVA were used as targets, as specified in the legend. B, GITR stimulation increases T cell functional avidity. The percentage of CD8 T cells secreting IFN-γ at decreasing peptide concentrations, normalized relative to the maximal response, is shown. Statistical differences (asterisks) were calculated between anti-CD4 and anti-GITR groups. D, Mice were vaccinated in the footpad with 10 μg OVA257 peptide emulsified in TiterMax and treated with anti-CD4 (day 0), LTF2 isotype control mAb (day 0), or anti-GITR (days 1 and 3). On day 5, cells pooled from lymph nodes were restimulated with the specified concentration of OVA peptide and the percentage of Ag-experienced CD8 T cells secreting IFN-γ was determined by flow cytometry. The y-axis represents the percentage of CD3+CD8+ CD44hiCD62Llow cells secreting IFN-γ when restimulated with 1 μM OVA peptide. Left, Each point represents a single mouse, horizontal lines represent averages, and asterisks represent statistical significance relative to isotype control. Right, Data were normalized relative to the maximal response at the highest peptide concentration. Symbols represent the average of five mice per group, and error bars represent standard deviations. Each experiment was conducted at least twice with similar results. *p < 0.05; **p < 0.01; ***p < 0.001.

