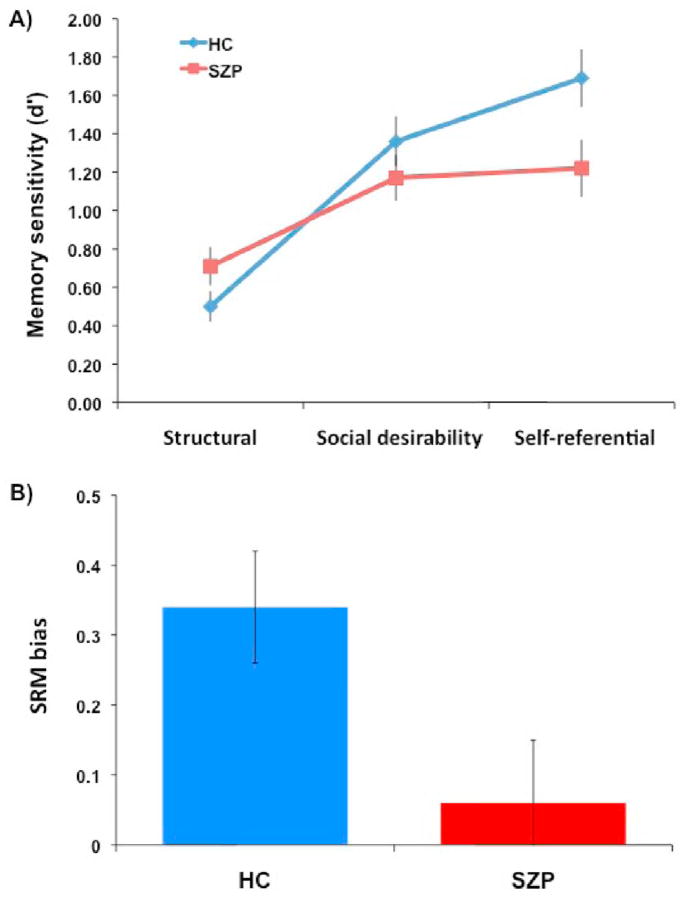
Figure 1.
Part A depicts the memory sensitivity (d′) for each group (HS = healthy controls and SZP = schizophrenia patients) and each encoding condition (Structural, Social desirability, Self-referential). Part B shows the mean magnitude of SRM bias (d′ self-referential - d′ social desirability) for each group. The bars in both panels represent standard errors.

