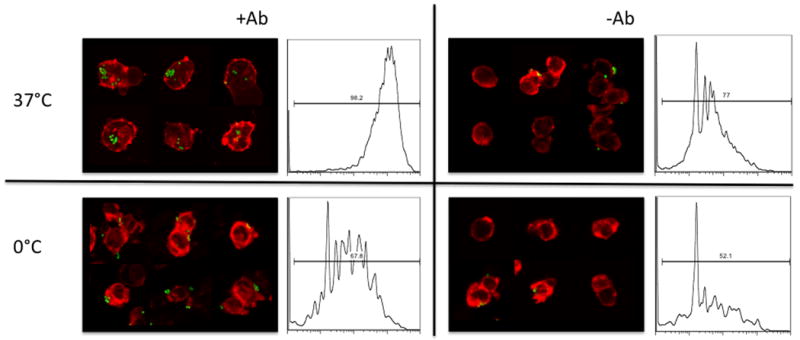
Figure 2. Phagocytosis Assay.

Confocal microscopy images and flow cytometry histograms of phagocytosis of green fluorescent beads with or without antibody coating, at 37°C or 0°C. For confocal microscopy, membrane was stained red with the membrane dye, DiI. Histograms represent the fluorescent signal from cell-associated beads. Bead uptake is maximal under conditions where FcγR-mediated phagocytosis can occur.
