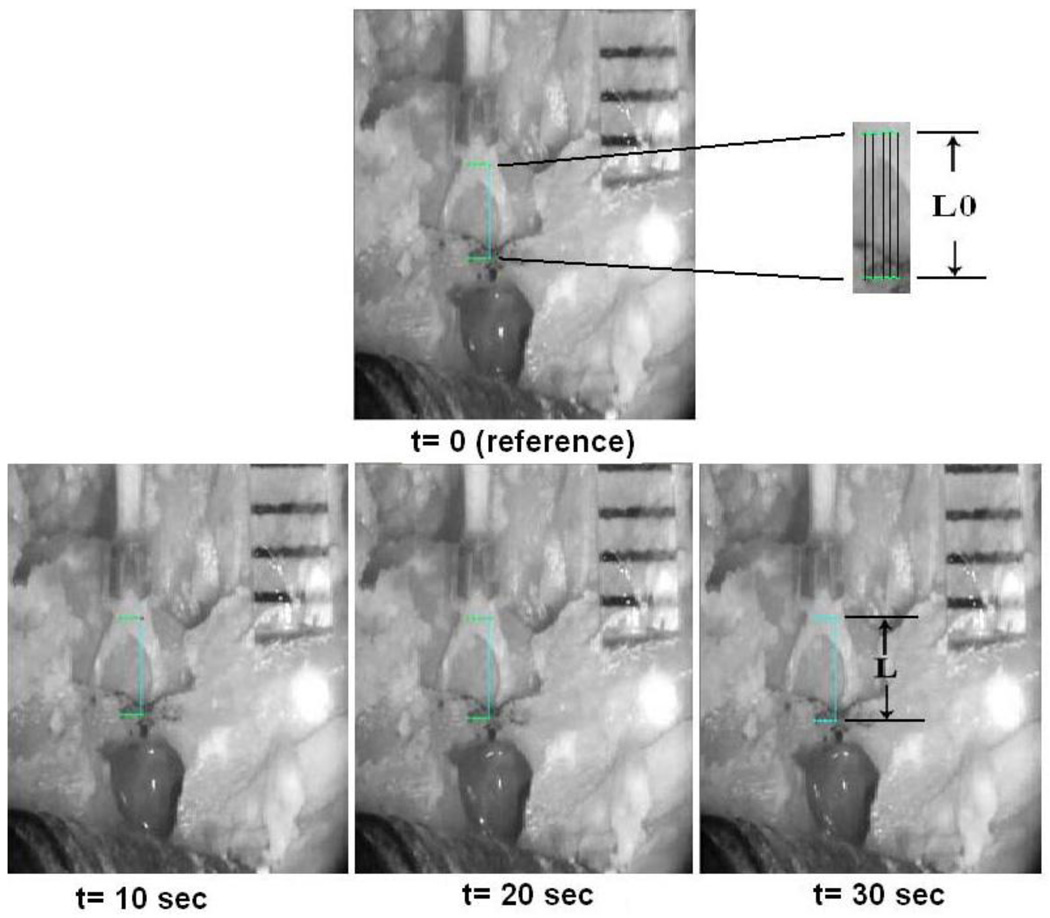
FIGURE 2.
Digital image correlation (DIC) method for calculating the strain of the SAL under loading process. The image at time t=0 was used as reference image and three images of the specimen at constant time intervals (t=10, 20, 30 s) were used as deformed images. A grid was generated at the stapes head (moving part) and bony wall (fixed part). The horizontal and vertical lines were identified by connecting five points horizontally and two points vertically. The length of the vertical line in reference image is measured as the original length (L0) and the length of the vertical line in deformed images is the deformed length (L).

