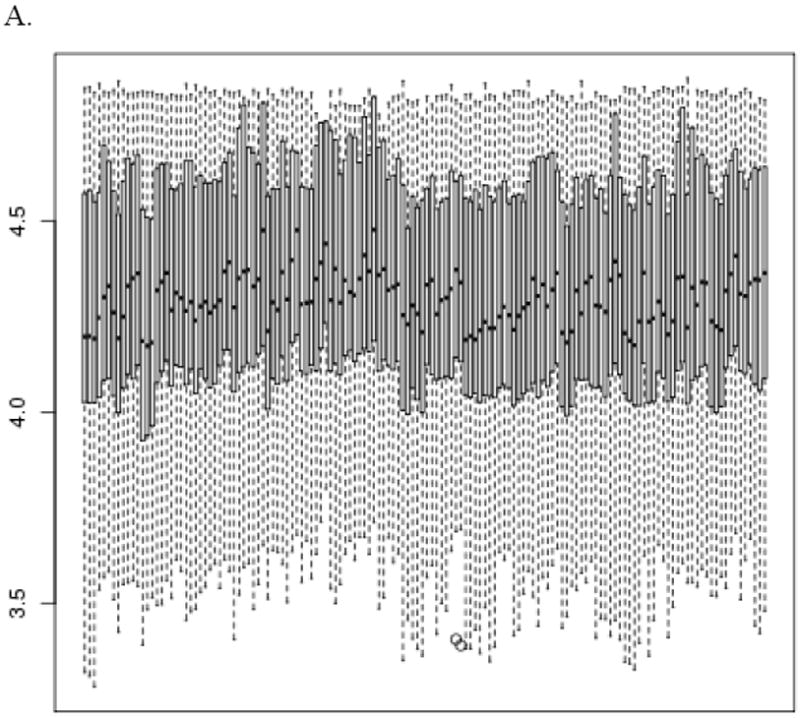
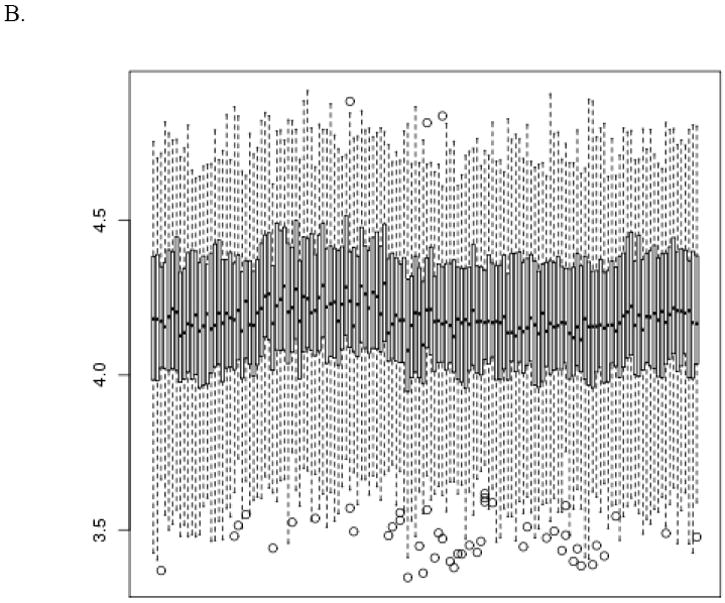
Figure 1.


Pre- (panel A) and post- (panel B) normalization box and whisker plots of the ΔCT values for all specimens, sorted by TLDA plate run order. The vertical axis is log base 2 ΔCT and the horizontal axis corresponds to specimen ID. The bottom and top of the box represent the 25th and 75th percentiles of the probe expression values. The horizontal bar inside the box represents the median. The whiskers extend to either 1.5 times the interquartile range (75th percentile minus the 25th percentile) beyond the box or the most extreme point, whichever is shorter. Points beyond that range are shown as circles.
