
Figure 2.
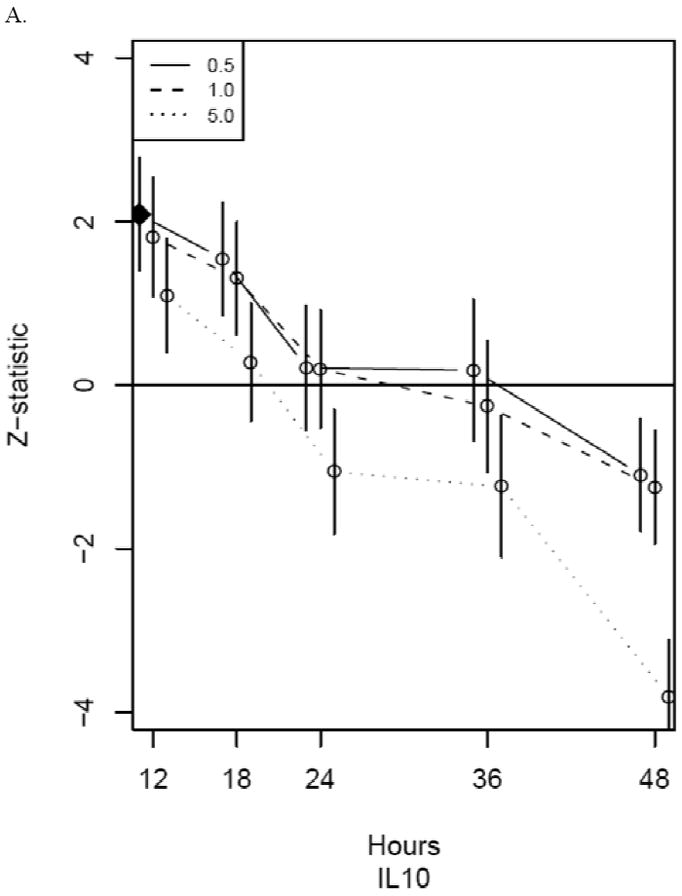
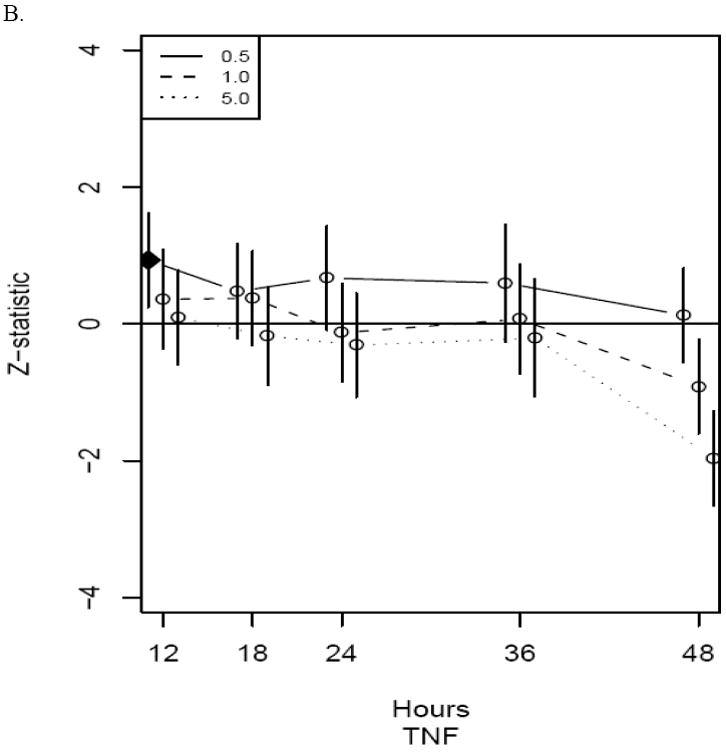
Z-statistics for IL10 (panel A) and TNF (panel B) for each time/MOI combination. The vertical axis is the standardized model-based estimate of change from control and the horizontal axis corresponds to time in hours of exposure to vaccinia. Line types indicate MOI as indicated in legends. The closed diamond indicates the time/MOI combination with the maximum absolute Z-score (excluding time=48 hours) for that gene while the open circles indicate non-maximum standardized model-based estimates. Vertical bars indicate Z-transformed ± 1 standard error limits. Dots for the three MOIs are jittered somewhat at each time to enable complete viewing of the confidence intervals.