
Figure 3.
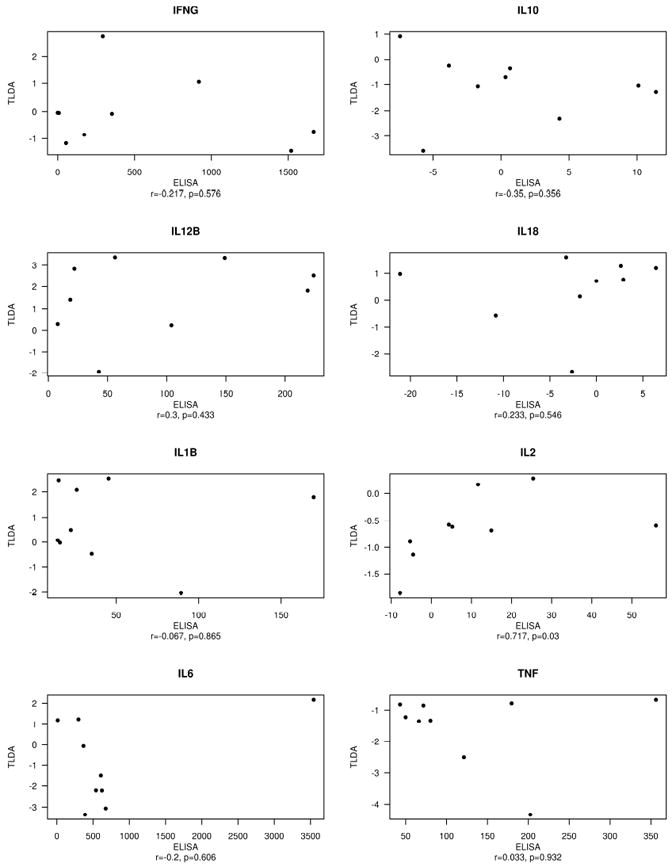
Scatter plots demonstrating relationship between normalized TLDA gene expression on the y-axis and cytokine secretion measured by ELISA on the x-axis. Both axes are fold change from control. Spearman correlations and associated p-values are included in axis labels. Cytokines are indicated in panel titles. IL-4 did not express on the TLDA, so is not shown.