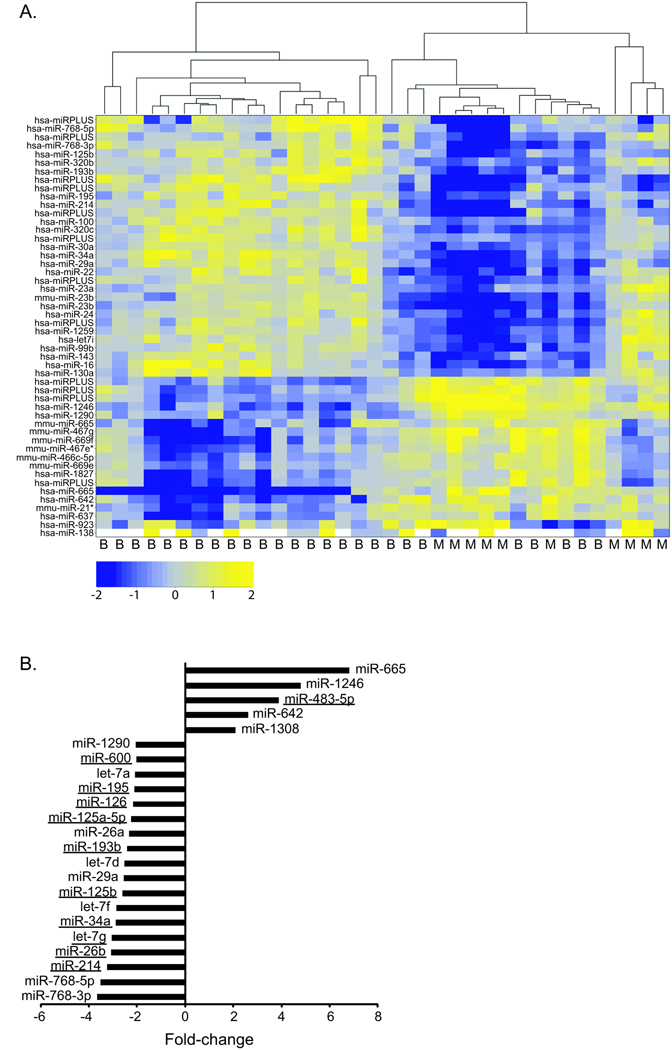
Figure 2. Identification of differentially expressed miRNAs using microarray analysis.
A. Unsupervised clustering was performed on the 50 most variable miRNAs. The most variable miRNAs were defined by the greatest absolute deviation from the mean across all samples. The Pearson correlation coefficient was used as the similarity metric in this analysis. The heatmaps show the clustering between clinical samples (columns) and the intensity of miRNA expression (log2 (tumor/normal), rows). The tumor diagnosis, either benign (B) or malignant (M), was indicated below. The microarrays included probes for mouse (mmu), human (hsa), and unannotated (miRPLUS) miRNAs (Exiqon LNA miRNA array v. 11.0). B. The top miRNAs significantly up- or down-regulated in ACC as compared to benign adrenocortical tumors were identified as those that were statistically significantly different (p<0.01, Ho: there is no difference between the expression in benign and malignant tumors) and had an expression difference of at least two-fold (up or down) between the two tumor classes were classified as the most differentially expressed. 23 miRNAs fit this criteria and the fold change for each is plotted (negative values indicate decreased expression in malignant and positive values indicate increased expression in malignant). The underlined miRNAs were chosen to be validated by real-time quantitative RT-PCR.

