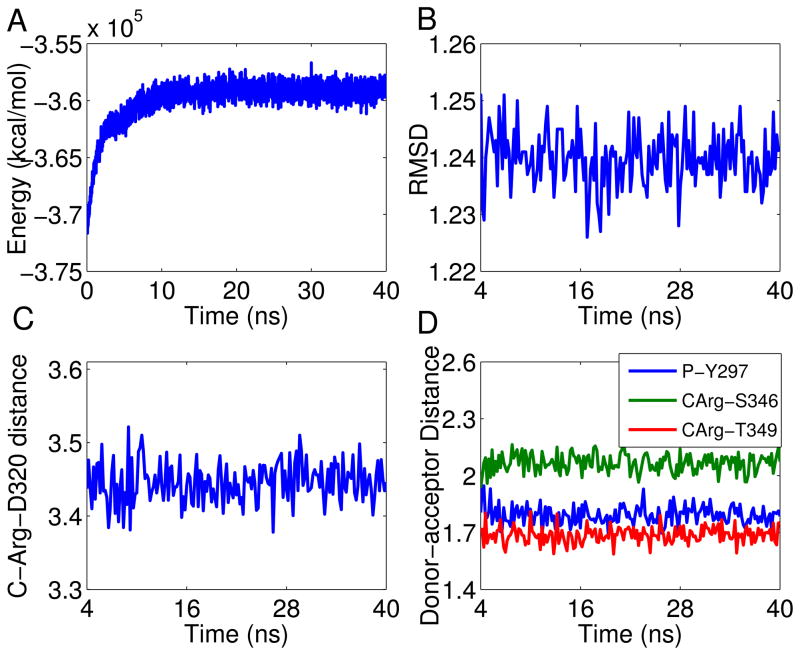
Figure 2.
NRP-1 – RPAR trajectory analysis: (a) Temporal evolution of the potential energy for the NRP – RPAR complex during the MD simulation; (b) Temporal evolution of the RMSD of the NRP-1 – RPAR complex during the MD simulation. The RMSD was calculated with respect to the minimized structure and was measured considering the backbone atoms only, to reduce noise; (c) Temporal evolution of the distance between Asp-74 of NRP-1 and the C-terminal Arg of RPAR. The distance is between the charged centers of these two amino acids; (d) The distance between the donor and acceptor centers of the three conserved hydrogen bonds between NRP-1 and RPAR. See inset legend for details. CArg refers to the C-terminal Arg residue of RPAR.

