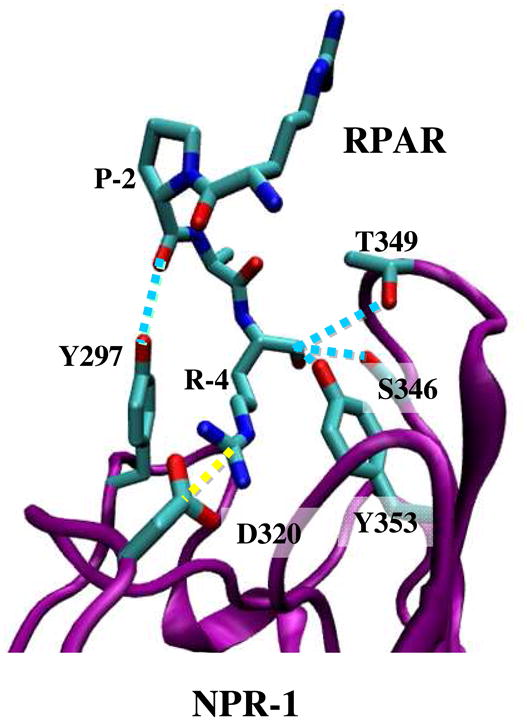
Figure 3.

Ribbon representation of the NRP-1 – RPAR complex showing the most notable interactions found between the peptide and the binding pocket of NRP-1. The ligand and the interacting side chains of the receptor are depicted as solid lines. NRP-1 backbone is shown in purple and RPAR backbone in green Hydrogen atoms are omitted for clarity. Specific interactions are drawn: hydrogen bonds are shown as blue discontinuous lines while salt bridges are marked by yellow discontinuous lines.
