
Figure 4.
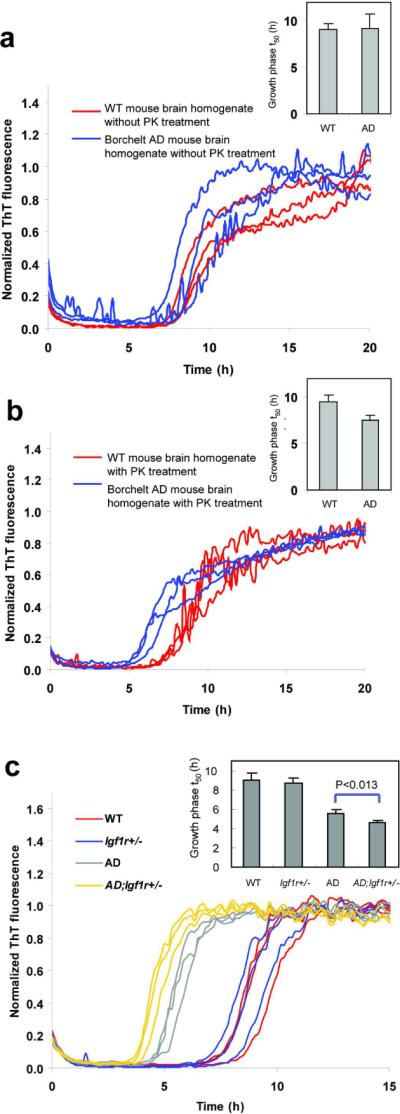
Aβ1–40 kinetic aggregation traces with added mouse brain homogenate. Triplicate results are shown in each figure. (a) Wild type (WT) or AD mouse brain homogenate without PK treatment. Inset: t50 of the kinetic aggregation traces. Data are reported as mean ± SD of triplicate results. (b) WT or AD mouse brain homogenate with PK and PI treatment. Inset: t50 of the kinetic aggregation traces with data reported as mean ± SD of triplicate results. (c) WT, Igf1r+/−, AD and AD;Igf1r+/− mouse brain homogenates with PK and thermal denaturation treatment. The mouse brain homogenates were sonicated for 40 min, treated with PK for 2 h, then boiled for 10 min, sonicated for an additional 20 min, and added to the Aβ1–40 kinetic aggregation assay. Inset: t50 of the kinetic aggregation traces with data reported as mean ± SD. p < 0.013 between AD and AD;Igf1r+/− (analyzed using a two-tailed student's t-test).