Figure 2.
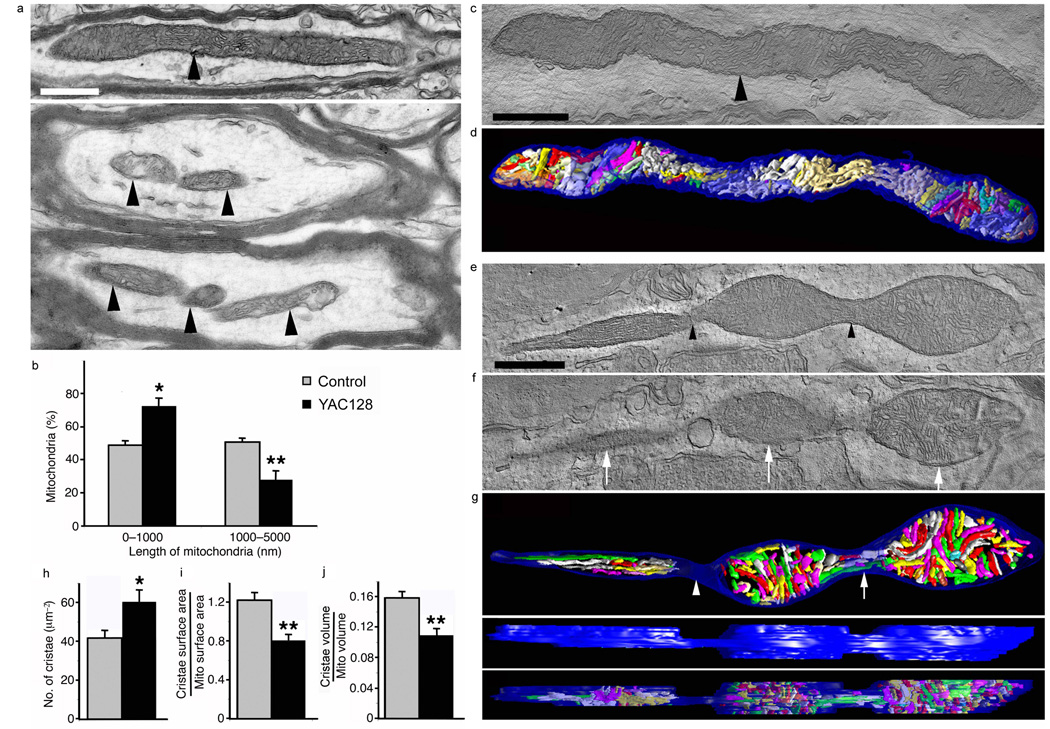
Mutant HTT increases the number of small mitochondria and cristae, but decreases cristae surface area and volume in the striatum of six-month old YAC128 mice. (a) EM of control (top) and YAC128 (bottom) brain showing an elongated neuronal mitochondrion (arrowhead) and several short mitochondria (arrowheads), respectively. Scale bar, 500 nm. (b) Percentage of mitochondria of short length (0–1,000 nm) and long length (1,000–5,000 nm). (c) EM of a control mitochondrion (arrowhead) nearly 4 µm long. (d) Surface-rendered volume showing the normal structure of its 84 cristae. (e) EM of a mitochondrion fissioning into three parts (arrowheads). (f) A slice of the volume shows the separation of the three mitochondrial bodies (arrows). (g) Top view showing all 223 cristae. There are no cristae in the constriction (arrowhead) between the left and middle bodies, but a few cristae appear in the constriction between the middle and right bodies (arrow). Side view of the outer membrane showing the width of the constrictions. Side view demonstrating cristae fragmentation by how few cristae extend from top to bottom of the volume. (h) Number of cristae per mitochondrial cross-sectional area. (i, j) Cristae surface area and volume. Data are mean ± s.e.m. Statistics: Student’s t-test, P < 0.05*, P < 0.01**.

