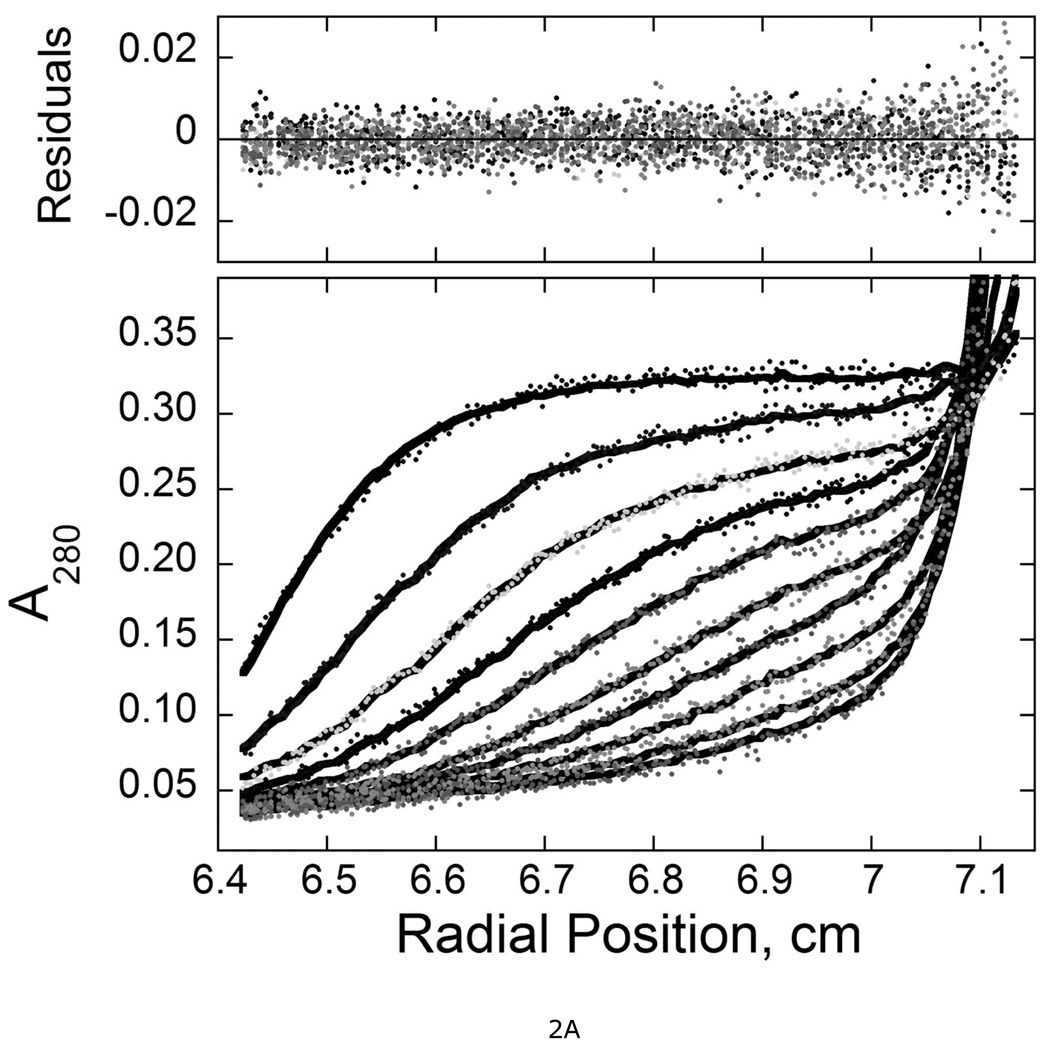
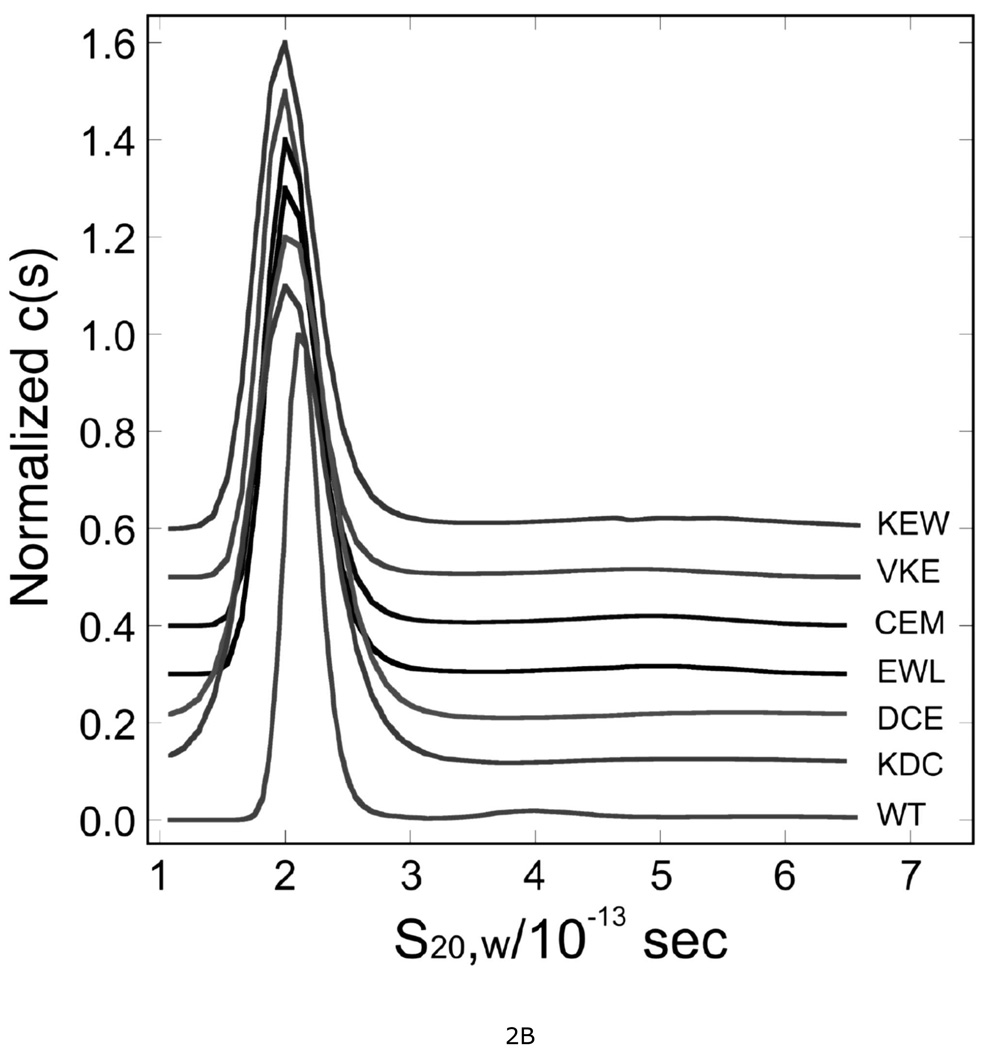
Figure 2. Sedimentation velocity analysis of wild-type and mutant AGT proteins.
A. Time-evolution of boundary sedimentation in a solution of wild type AGT in 50 mM potassium phosphate pH 7.4. Centrifugation was performed at 4°C and 40,000 rpm. Data collected as a function of time are shown in the lower frame. Scans shown here were taken 40 min apart. Data were fit (solid black curves) using numerical solutions to the Lamm equation for the continuous c(s) model implemented in the program SEDFIT (28, 47). The small, symmetrically-distributed residuals (upper panel) demonstrate that this model accounts well for the data. B. Distributions of c(s) for wild-type and mutant AGT proteins. Values of c(s) are normalized so that the maximum Δc(s) in each profile is 1 absorbance unit. Profiles are offset by 0.1 absorbance unit from their nearest neighbors for clarity. Sequences replaced by alanine triplets are indicated.


