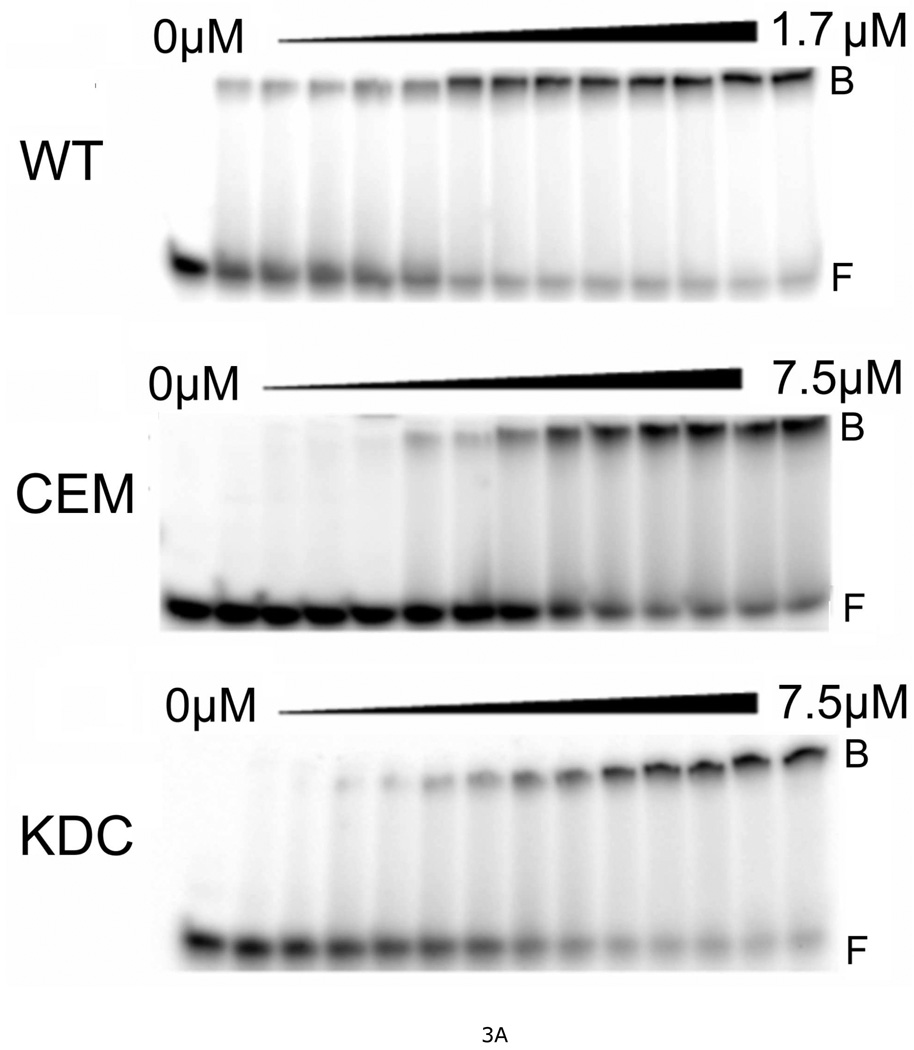
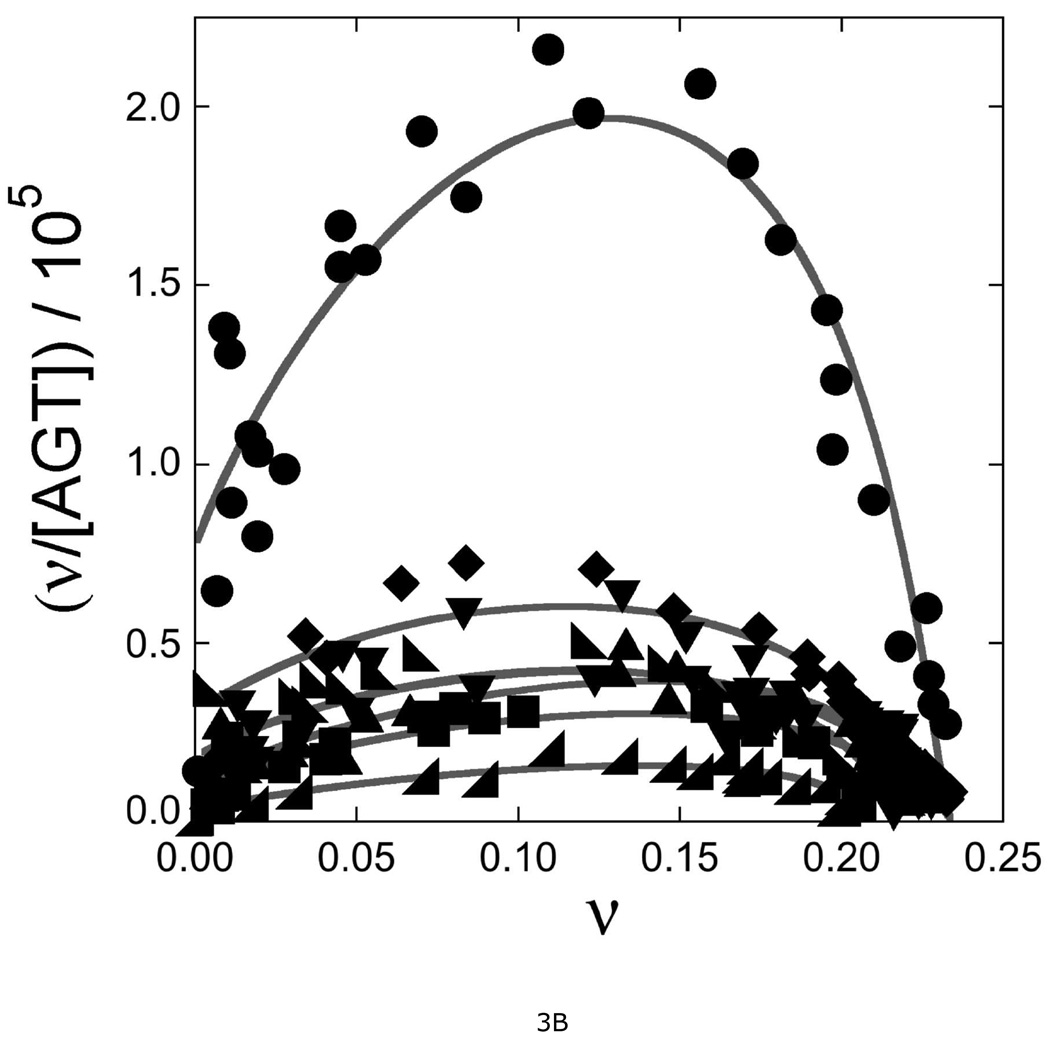
Figure 3. Measurement of DNA-binding affinities for wild-type and mutant AGT proteins.
A. Representative EMSA analyses. Titrations of 32P-labeled double-stranded 26-mer DNA (2 × 10⁻⁷M) with wild-type AGT, CEM(5–7)-AAA and KDC(3–5)-AAA mutants. Protein concentrations ranged from 0 (first lane at left in each panel) to 1.7µM (wild-type AGT) or 7.5µM (mutant proteins). Binding reactions were carried out at 20 ± 1°C in 10 mM Tris (pH 8.0 at 20°C), 50 mM KCl, 0.1 mM DTT. Band designations: B, bound DNA; F, free DNA. Although these images have been cropped and labeled for clarity, no additional bands were detectable between the origin of electrophoresis and the ionic front. B. Scatchard plots for AGT binding to duplex 26mer DNA. Data derived from mobility shift assays, including those shown in panel A. Symbols: (●) data for wild-type AGT; (♦) data for KDC(3–5)-AAA AGT; (▼) data for CEM(5–7)-AAA) AGT; (◣) data for VKE(164–166)-AAA AGT; (▲) data for EWL(166–168)-AAA AGT; (■) data for DCE(4–6)-AAA AGT; (◢) data for KEW(165–167)-AAA AGT. The smooth curves are fits of Equation 1 to these data sets; fitting parameters are summarized in Table 2.


