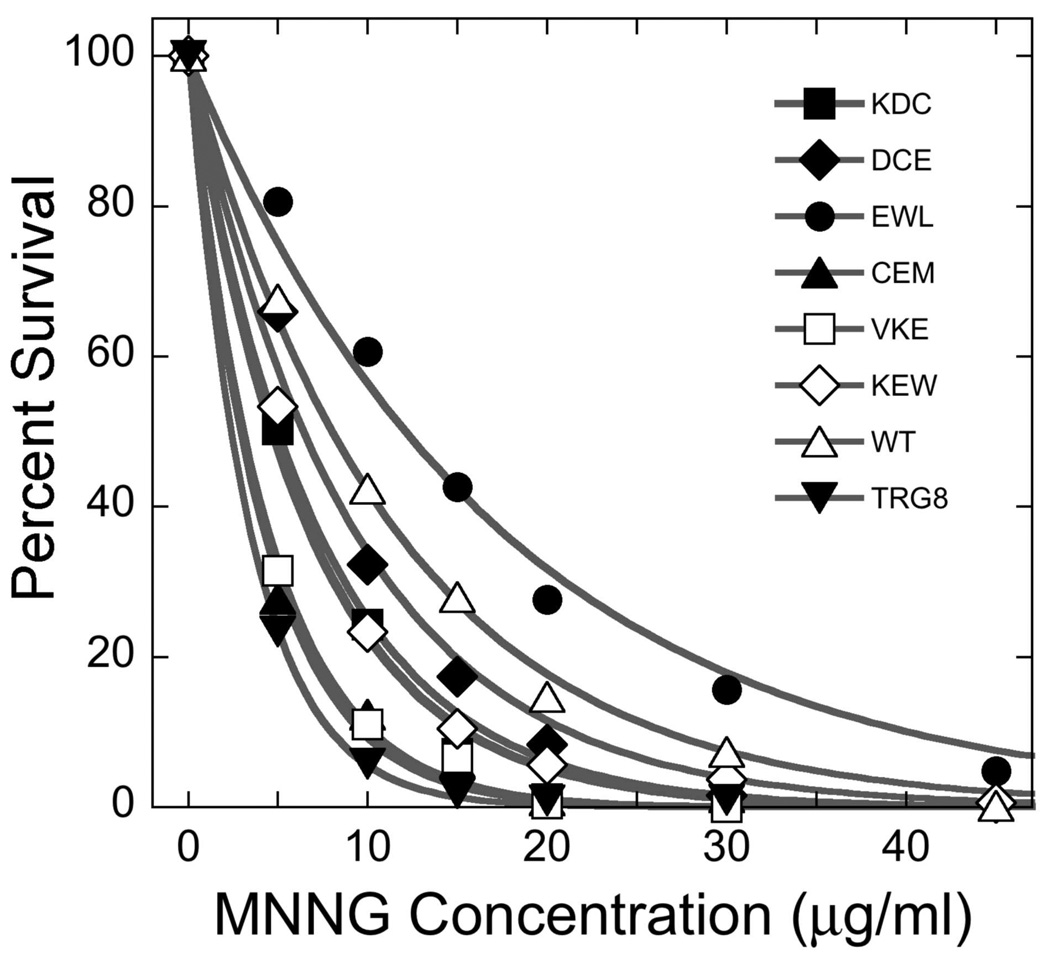
Figure 4. MNNG survival assays.
Liquid cultures of TRG8 cells expressing wild-type or mutant AGT proteins were exposed to 0–45µg/mL MNNG for 30 min. Serial dilutions were plated and colonies were counted after 24h of culture at 37°C. Percent survival was calculated as 100 × C(MNNG)/C(control), where C(MNNG) is the number of colonies per mL of culture exposed to MNNG and C(control) is the corresponding number of colonies in parallel cultures not exposed to MNNG. The smooth curves are fits of a single-exponential decay function to the data.

