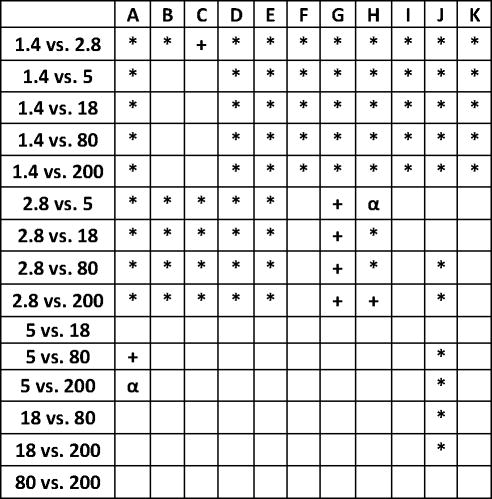
Figure 1.
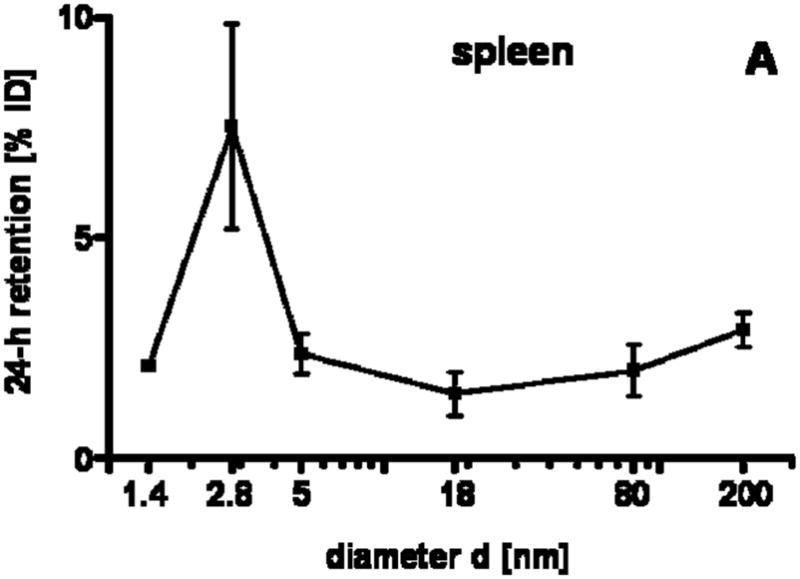
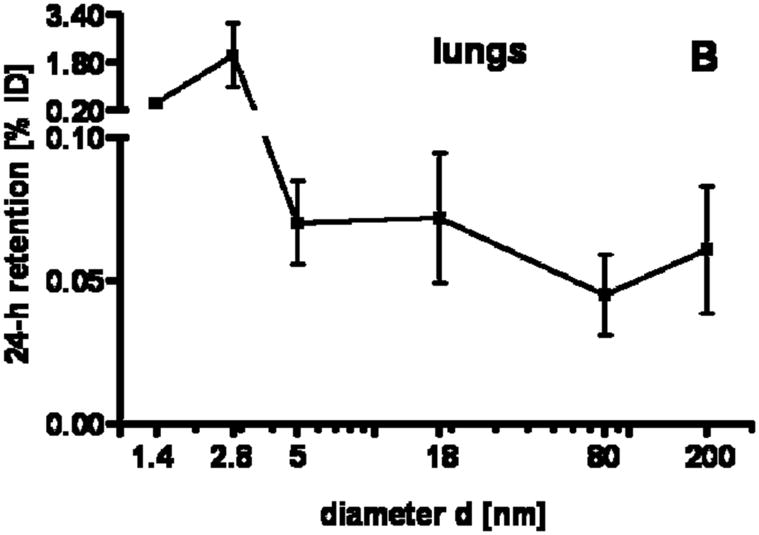
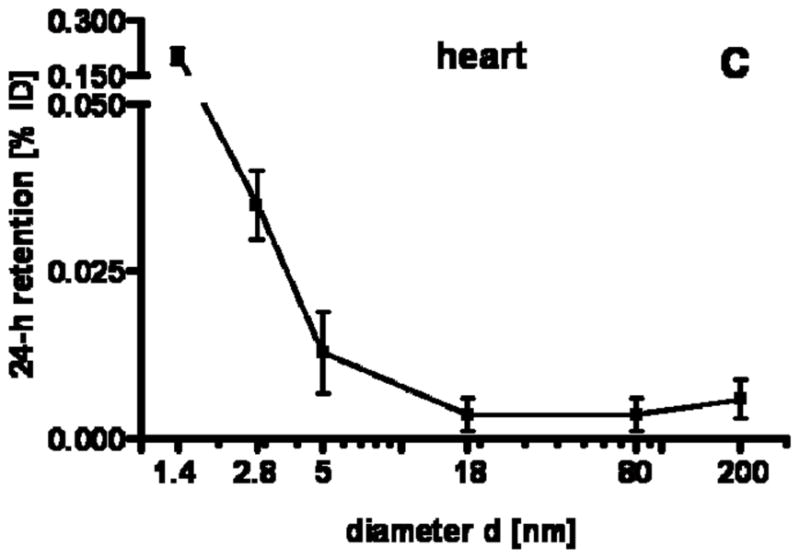
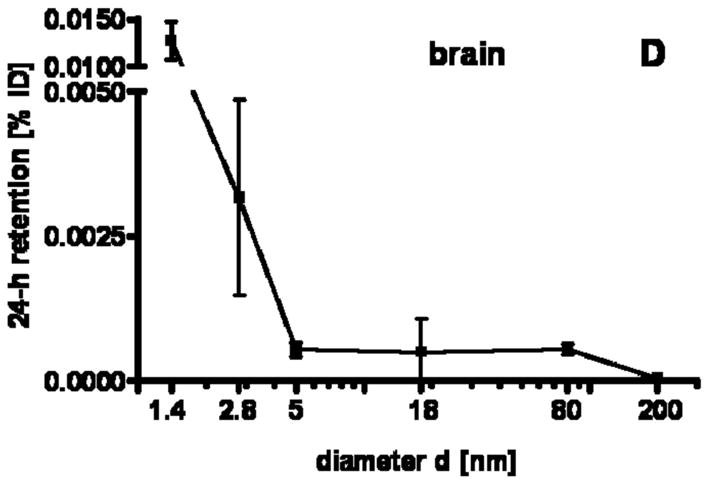
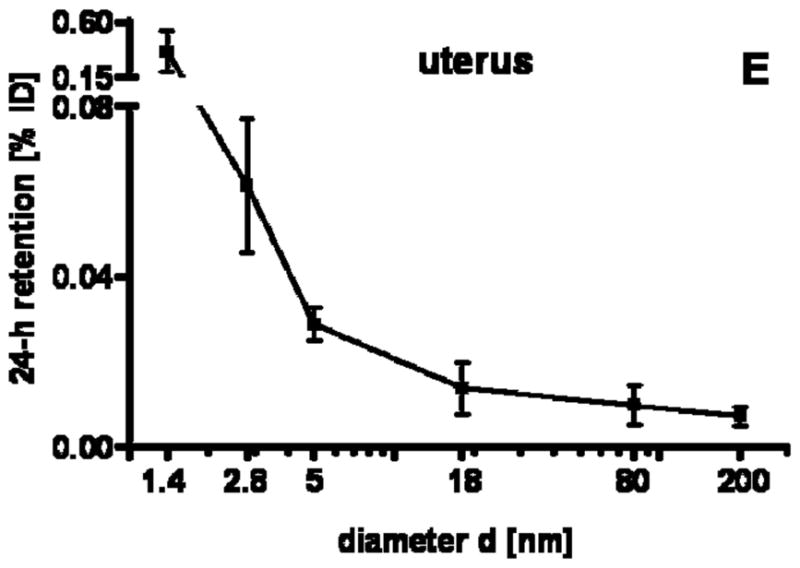
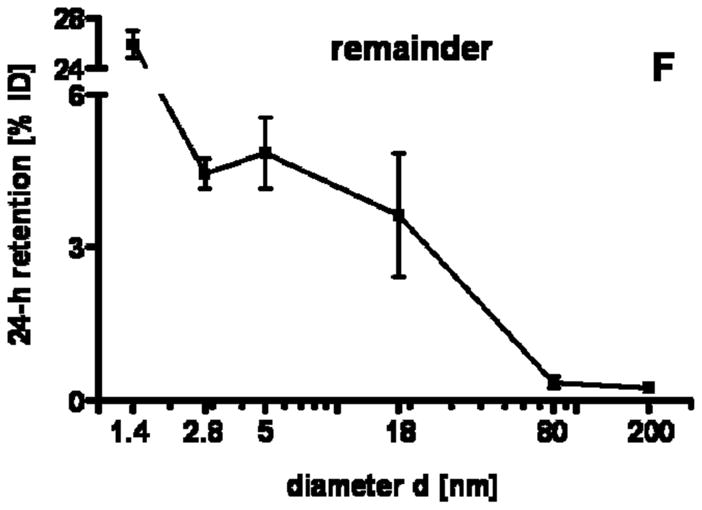
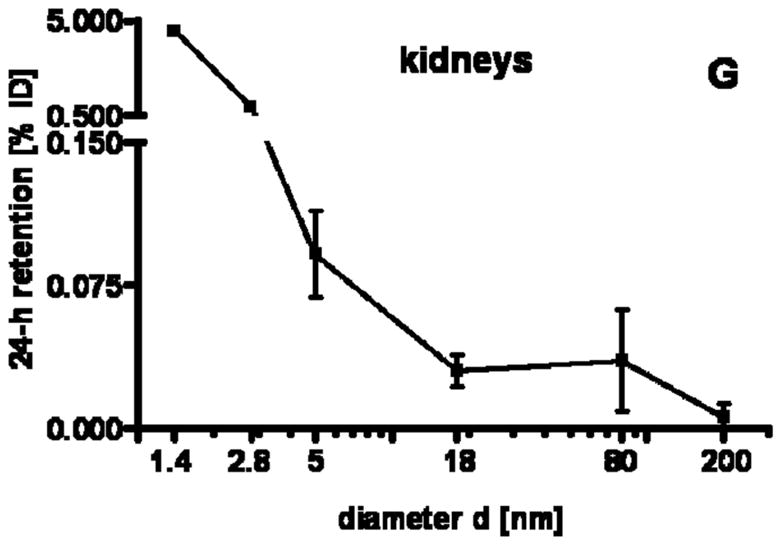
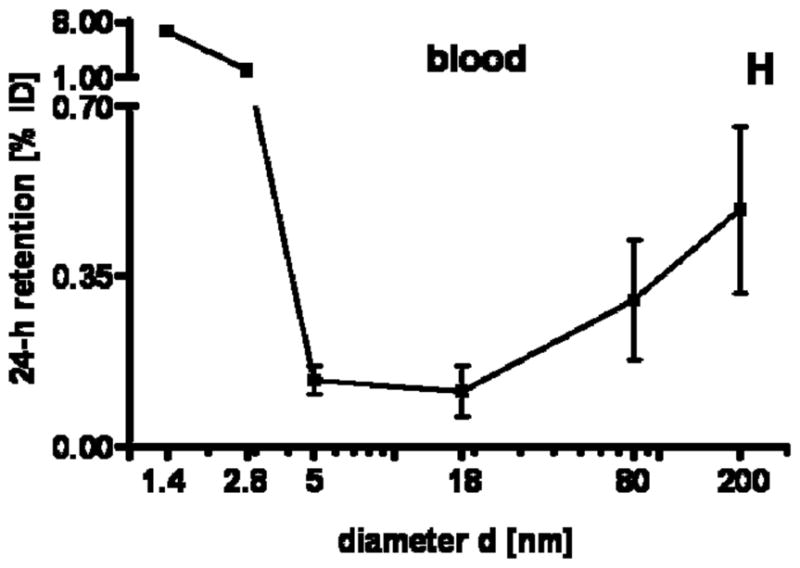
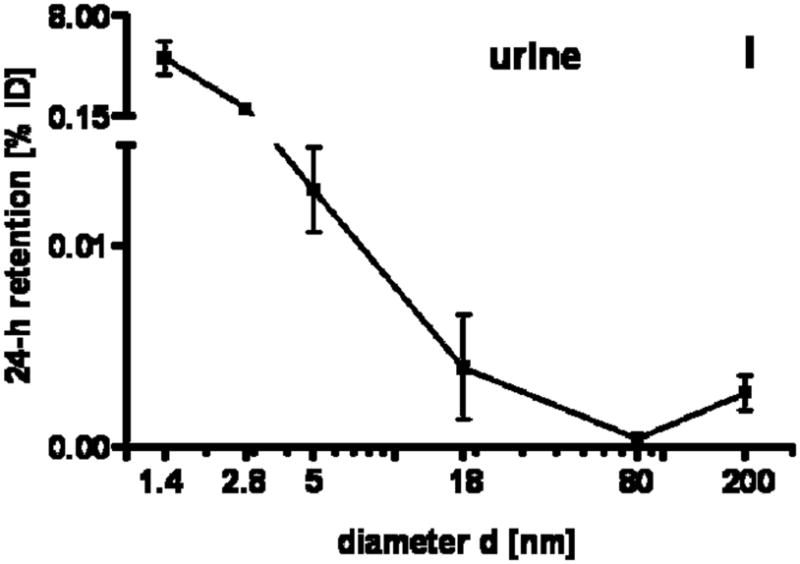
24 h retention/accumulation of intravenously injected, negatively charged, spherical GNP (1.4nm, 5nm, 18nm, 80nm, 200mm coated with TPPMS; 2.8nm carboxyl-coated); GNP percentages of initial dose are given for whole organs, the entire remaining carcass and total blood and urine; in each panel the respective organ, tissue or body fluid is indicated. Data are mean + SD, n = 4 rats. Note log scale of x-axis. In the table panel significant changes of accumulation of given GNP sizes versus those of all other GNP sizes are listed as determined by the ANOVA test. (* p<0.05, + p<0.01; α p<0.001).

