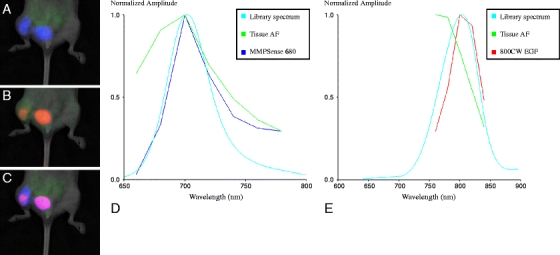
Fig. 4.

Illustration of the use of two fluorescent agents with emission on different wavelengths, showing the simultaneous detection of an MDA-MB231 breast cancer bone metastases in the right hind limb of a nude mouse. MDA-MB231 cells express relatively high levels of EGFR and are highly osteolytic. Nonspecific uptake of the probes in the bladder is also shown. a Fluorescent image showing the blue signal of MMPSense™ 680; green is tissue autofluorescence. b Fluorescent image showing the red signal of IRDye® 800CW EGF; green is tissue autofluorescence. c Fluorescent composite image showing both signals simultaneously (purple); green is tissue autofluorescence. d Graphic showing peak signal intensity of MMPSense™ 680 at 700 nm (blue line), unmixed from autofluorescence (green line). e Graphic showing peak signal intensity of IRDye® 800 CW EGF at 800 nm (red line), unmixed from autofluorescence (green line). The MMPSense signal covers a larger area compared to the IRDye® 800CW EGF signal. This is most probably due to the fact that IRDye® 800CW EGF only detects the MDA-MB231 cells, whereas MMPSense also detects the highly increased osteoclastic bone resorption (ostelytic lesion) as a result of matrix metalloproteinase-9 expression of resorbing osteoclasts. AF autofluorescence.
