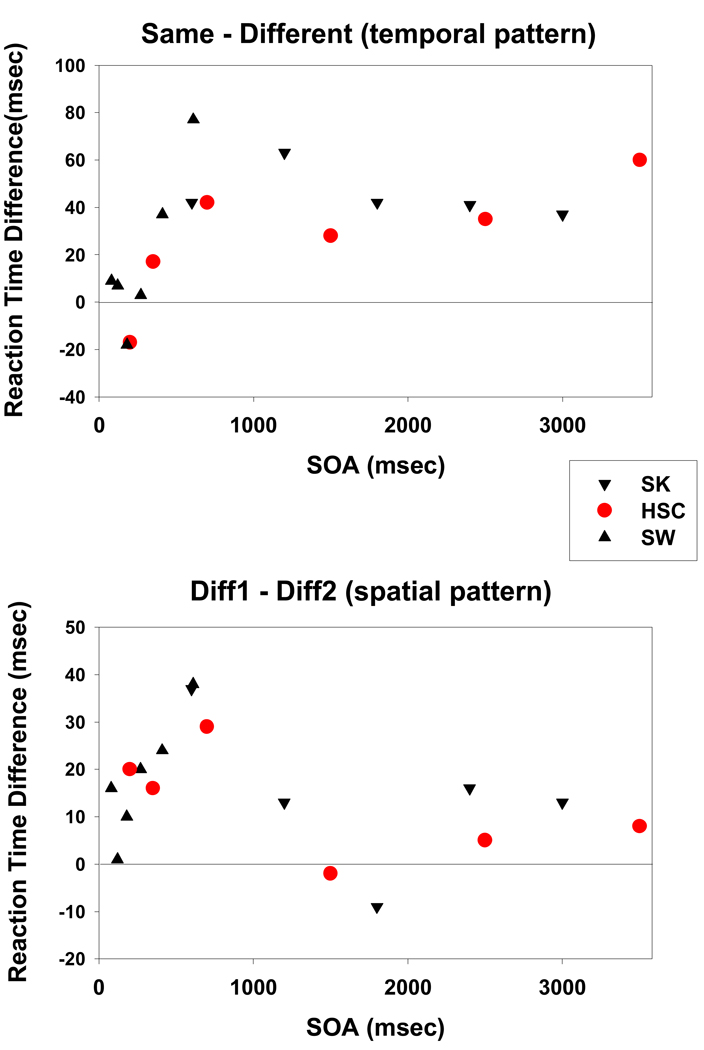
Figure 2.
Top panel: IOR effects (difference in RT between Same and average of the two Diff locations), from Samuel & Weiner (2001; Experiment 1) [upward triangles], Samuel & Kat (2003; Experiment 1) [downward triangles], and the current study’s Experiment 1 [circles]. Bottom panel: Spatial differences in IOR (difference in RT between Diff1 location and Diff2 location); same symbols as top panel.

