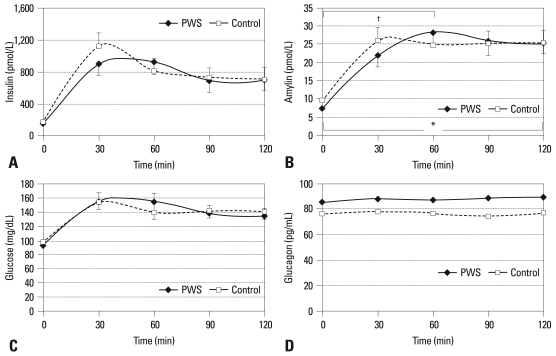
Fig. 1.
Changes in plasma insulin, amylin, glucose, and glucagon levels after the glucose challenge. Repeated-measures ANOVA showed a significant amylin × time interaction, indicating that changes in amylin over time were significantly different between the two study groups (*p = 0.0154). Amylin levels between 0 and 60 min after glucose loading were statistically different between the two groups (†p = 0.0076). PWS, Prader-Willi syndrome; ANOVA, anlysis of variance.

