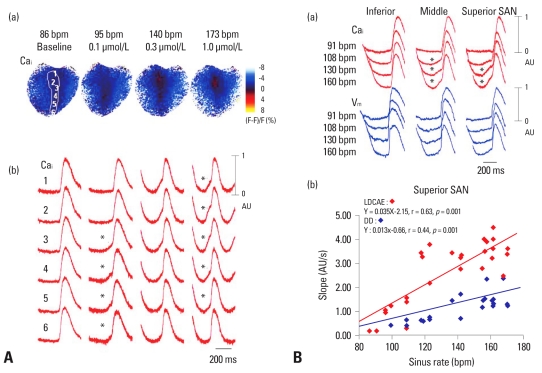
Fig. 2.
Co-localization of LDCAE and the leading pacemaker site. (A) Upward shift of the leading pacemaker site with LDCAE during isoproterenol infusion. (a) Cai ratio maps of SAN at each sinus rate. (b) Corresponding Cai tracings from superior (1, 2), middle (3, 4) and inferior (5, 6) SAN. At 95 bpm, the sites 4 and 5 had most prominent LDCAEs (asterisks). As sinus rate gradually increased, the sites of Cai elevation progressively moved upward. At the maximum sinus rate of 173 bpm, the site 2 had the most apparent LDCAE. (B) Differential responses of different SAN sites to isoproterenol. (a) The Cai and Vm tracings from inferior, middle, and superior SAN sites at different sinus rates. (b) The LDCAE and DD slopes of superior SAN at different sinus rates. This figure was reproduced with permission from Joung, et al.23 SAN, sinoatrial node; LDCAE, late diastolic Cai elevation; DD, diastolic depolarization.

