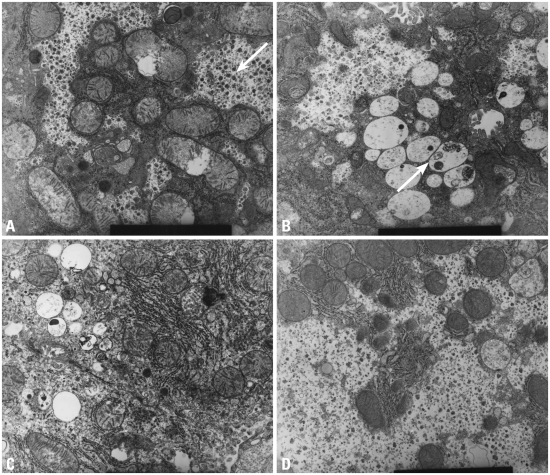
Fig. 1.
High power electron microscopic findings (9.0 × 9,000). (A) Wild type: the arrow shows large amounts of glycogen particles in the cytoplasm. (B) MPS II model: the arrow shows accumulation of GAG in lysosomes and scanty glycogen content in the cytoplasm. (C) Low dose ERT group: GAG in the lysosomes decreases but restoration of glycogen in the cytoplasm is not remarkable. (D) High dose ERT group: GAG in the lysosomes nearly disappears and glycogen particles in the cytoplasm are restored. MPS II, mucopolysaccharidosis II; GAG, glycosaminoglycan; ERT, enzyme replacement therapy.

