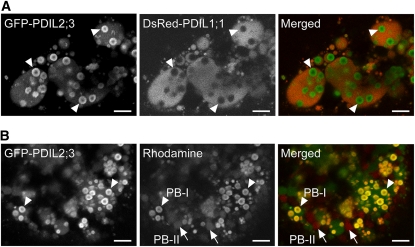
Figure 1.
PDIL2;3 Localizes on the Surface of PB-I in the Endosperm.
(A) Confocal fluorescence images of the outer region of endosperm (10 d after flowing [DAF]) expressing both spGFP-PDIL2;3 and spDsRed-PDIL1;1. The fluorescence signals of GFP-PDIL2;3 (left panel) and DsRed-PDIL1;1 (middle panel) were converted to green and red, respectively, and merged (right panel). Arrowheads indicate PB-I in the ER lumen.
(B) PB-I (arrowheads) and PB-II (arrows) were visualized by Rhodamine staining. The fluorescence signals of GFP-PDIL2;3 (left panel) and Rhodamine (middle panel) were converted to green and red, respectively, and merged (right panel). The fluorescence signals of DsRed-PDIL1;1 were not visible under the conditions for obtaining Rhodamine signals at the appropriate intensity.
Bars = 5 μm.

