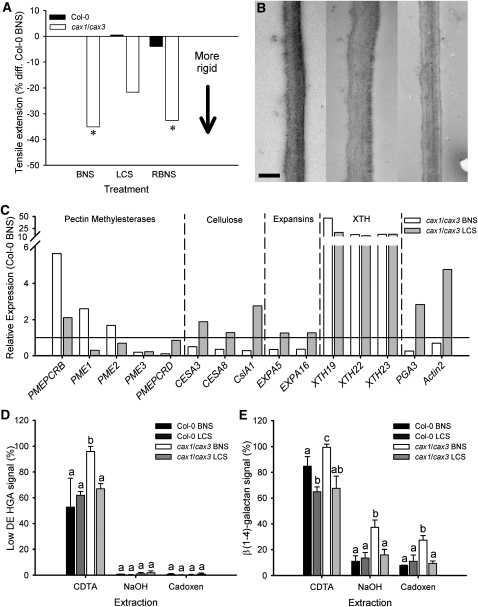
Figure 4.
Cell Wall Rigidity and Architecture of cax1/cax3 Loss-of-Function Mutant Leaves Recoverable by Low Calcium Treatment and Correlated with Gene Expression.
(A) Tensile extension at maximum break for Col-0 (black bars) and cax1/cax3 (white bars) of leaves 7 to 11 from plants grown in BNS (Col-0, cax1/cax3) (n = 52 and 32), LCS (n = 35 and 28), or RBNS (n = 28 and 30) over four experimental runs. Student’s t test was performed on raw data comparing Col-0 and genotype/treatment; asterisk indicates significance at P < 0.05. Data shown as normalized to the percentage of difference from Col-0 in BNS.
(B) Increase in cell wall thickness of cax1/cax3 plants ameliorated by reducing apoplastic Ca. Representative single spongy mesophyll cell wall from BNS-grown Col-0 (left panel), cax1/cax3 (middle panel), and LCS-grown cax1/cax3 (right panel) leaf sections. Images captured on a Philips CM100 transmission electron microscope equipped with Megaview II Image capture running iTEM software (SIS Image Analysis) (n = 160 from 40 spongy mesophyll cell wall segments, four readings per segment from three independent leaf specimens). Values for Col-0 BNS, 185 ± 11 nm; Col-0 LCS, 170 ± 11 nm; cax1/cax3 BNS, 250 ± 16 nm; cax1/cax3 LCS, 209 ± 10 nm (mean ± se). Bar = 200 nm.
(C) qPCR on cell wall biosynthesis genes performed on RNA from 6-week old Col-0 and cax1/cax3 plants grown in BNS and cax1/cax3 plants grown for 5 weeks in BNS and 7 d in LCS (0.025 μM Ca). Line at y = 1 represents expression level in leaves of Col-0 (n = 3 independent plant samples per treatment, with qPCR performed in triplicate). In this experiment, Actin2 is excluded as a normalization gene, instead using EF-1α, β-tubulin5, and GAPDH-A.
(D) and (E) Analysis of cell wall glycans from Col-0 and cax1/cax3 plants grown under both BNS and LCS treatments by CoMPP assay (Moller et al., 2007). Results of hybridization with JIM5 antibody (D) (low methyl-esterified HGA) and LM5 antibody (E) [for β(1→4)-linked galactan]. Presented as signal intensity with the strongest signal given the value of 100%; mean + se. Three biological replicate samples per genotype per condition, each comprised of material pooled from three independent plants, were analyzed in triplicate. a, b, and c represent data groups that are not statistically different, with each extraction treated independently, as determined by one-way ANOVA and Tukey’s HSD posthoc test.

