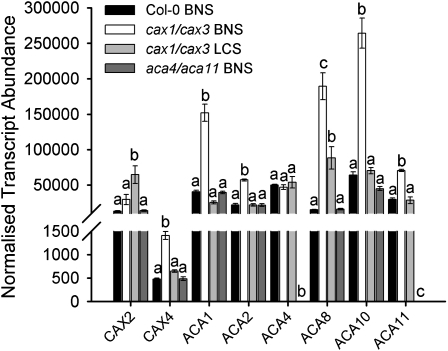
Figure 5.
Expression of Ca2+ Transporters in Col-0 and cax1/cax3 in BNS and LCS.
Transcript abundance of Ca2+ transporters in leaves of Col-0 and aca4/aca11 and cax1/cax3 T-DNA insertion lines. Transcripts were normalized against EF1α (At1g07940), β-tubulin5 (At1g20010), and Actin2 (At3g18780). Mean ± se, n = 3 plants. qPCR was performed in triplicate. a, b, and c represent data groups that are not statistically different, with each extraction treated independently, Student’s t test (P < 0.05).

