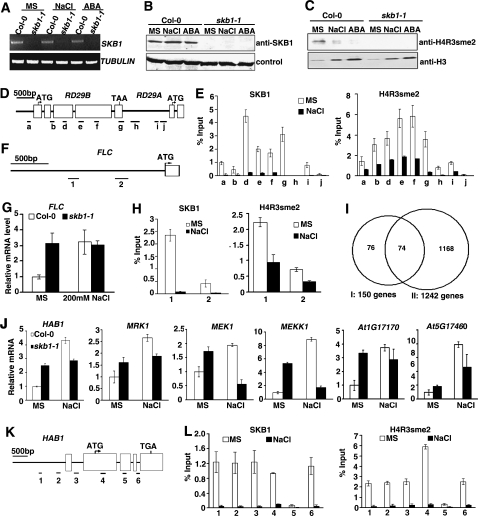
Figure 4.
SKB1 Expression Profile and H4R3sme2 Level in Global and Specific Sites in Response to Salt Stress and ABA Treatments.
(A) RT-PCR analysis of the expression of SKB1 in the wild type (Col-0) in response to salt stress and ABA treatment. Template RNA isolated from 11-d-old seedlings grown on MS medium was treated with 200 mM NaCl for 6 h or 100 μM ABA for 3 h. TUBULIN was the loading control. Three biological replicates were performed with similar results.
(B) Immunoblot analysis of SKB1 expression in response to salt stress and ABA treatment. Wild-type (Col-0) and skb1-1 plants were treated as in (A).
(C) Immunoblot analysis of Arg symmetric dimethylation modification of the H4R3sme2 level in response to salt stress and ABA treatment, using histone-enriched whole protein extract and an H4R3sme2-specific antibody. Wild-type (Col-0) and skb1-1 seedlings were treated as in (A).
(D), (F), and (K) Diagrams of the RD29A and RD29B (D), FLC (F), and HAB1 (K) genes structure, with bars representing the regions examined by ChIP shown in (E), (H), and (L), respectively. White boxes represent exons or 5′ or 3′ untranslated regions, and black lines represent introns.
(E), (H), and (L) ChIP assay for RD29B and RD29A (E), FLC (H), and HAB1 (L) performed with anti-SKB1 and -H4R3sme2 antibodies. Chromatin extracted from 11-d-old seedlings grown on MS medium was treated with 200 mM NaCl for 6 h or 100 μM ABA for 3 h, untreated as a control. Data represent triplicate multiquantitative PCR measurements of immunoprecipitated DNA, and the input represents chromatin before immunoprecipitation. Error bars represent relative sd of ChIP data.
(G) Quantitative RT-PCR analysis of the expression of FLC in response to salt stress. Template RNA isolated from 11-d-old seedlings grown on MS medium was treated with 200 mM NaCl for 6 h. The experiment was performed independently three biological replicates and normalized by TUBULIN expression. Error bars indicate the relative sd of three independent experiments.
(I) Venn diagram of genes upregulated in the skb1-1 mutant in standard conditions (a) and in the wild type after treatment with 200 mM NaCl for 6 h (b), as determined by microarray analysis.
(J) Real-time quantitative RT-PCR analysis of the expression of salt stress–induced genes in the wild type and skb1-1 mutant in standard and salt stress conditions. Template RNA, experiments, and data analysis are indicated in (G).

