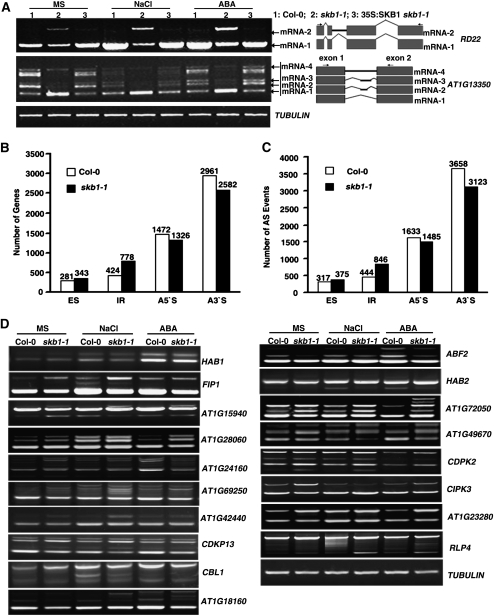
Figure 6.
RNA Splicing Analysis.
(A) RT-PCR analysis of the pre-mRNA splicing pattern of RD22 and AT1G13350 in wild-type (1), skb1-1 (2), and 35S:SKB1 skb1-1 (3) plants. Eleven-day-old seedlings grown on MS medium were treated with 200 mM NaCl for 6 h or 100 μM ABA for 3 h. Three biological replicates were performed with similar results. The splicing pattern of each alternative splicing isoform is shown at the right. Gray square, exon; black line, unspliced intron; bent line, spliced intron. Arrowheads at the right show primer locations.
(B) and (C) Statistical chart of alternative splicing (AS) genes and events. ES, exon skipping; IR, intron retention; A5′S, alternative 5′ splicing; A3′S, alternative 3′ splicing.
(D) The splicing pattern of genes in the wild type and skb1-1 mutant. Candidate genes were selected that were identified as having different splicing patterns in the wild type and skb1 mutant by transcriptome RNA sequencing.

