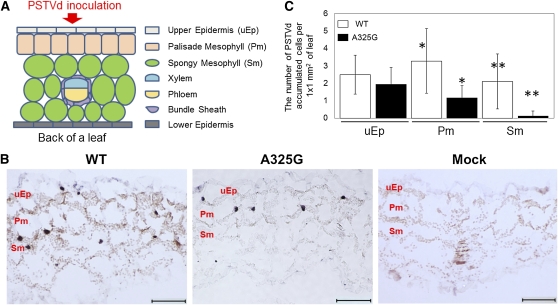
Figure 9.
In Situ Hybridization Localization of the Wild Type and A325G Mutant PSTVd in Inoculated Leaves of N. benthamiana.
(A) Schematic representation of a transverse section of a young N. benthamiana leaf.
(B) In situ hybridization on 14-μm thin sections of N. benthamiana leaves inoculated by wild-type PSTVd, A325G mutant, and water as a mock. Purple dots indicate viroid hybridization signals in the nuclei. Bars = 100 μm.
(C) Quantitative analysis of the cellular distribution of mutant A325G (n = 17) as well as wild-type PSTVd (n = 14). The “n” number represents the number of individual leaves (and therefore individual plants) sampled. See Methods for details on sampling and analysis. The data in the two columns indicated by an asterisk are significantly different (t test, P < 0.05). The numbers in the two columns indicated by double asterisks also are significantly different (P < 0.05). The nonhighlighted data in the two columns are not significantly different (P > 0.05). Each error bar indicates sd.

