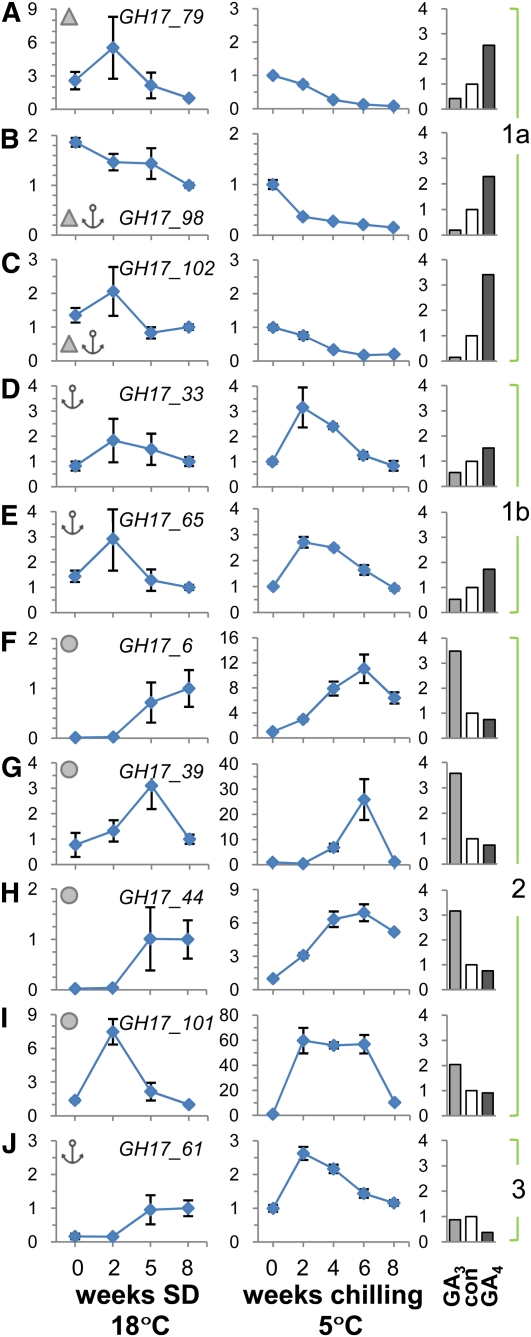
Figure 5.
qRT-PCR Analysis of Selected Genes Encoding Populus GH17 Family and PD-Associated Proteins.
The analysis was performed with apices and buds of hybrid aspen under conditions that mimic those during the phases of the annual dormancy cycle. The values are means (±se) of three biological replicates and represent fold changes (y axis) of indicated genes.
(A) to (J) Relative expression levels of indicated genes when plants were exposed to dormancy-inducing SD conditions for up to 8 weeks (line graphs on the left) and dormancy-releasing chilling conditions for up to 8 weeks (line graphs in the middle). Bar graphs on the right show fold changes after exposure to 10 μM GA3 and GA4, or water as a control (con), applied for 5 d to internodes with dormant buds. The genes were clustered into the functional groups 1 (subdivided into 1a and 1b), 2, and 3 based on their specific expression patterns and on the structural organization of their proteins.
(A) to (E) Group 1 GH17 members have a putative carbohydrate binding domain CBM43/X8 (triangles) ([A], [B], and [E]) and/or a GPI lipid anchor (anchors) ([B] to [E]).
(F) to (I) Group 2 GH17 members are putative lipid body proteins (circles).
(J) The group 3 member has a putative GPI lipid anchor. Line diagrams represent values relative to a control time point SD8. This time point was included separately in both SD and chilling experiments.

