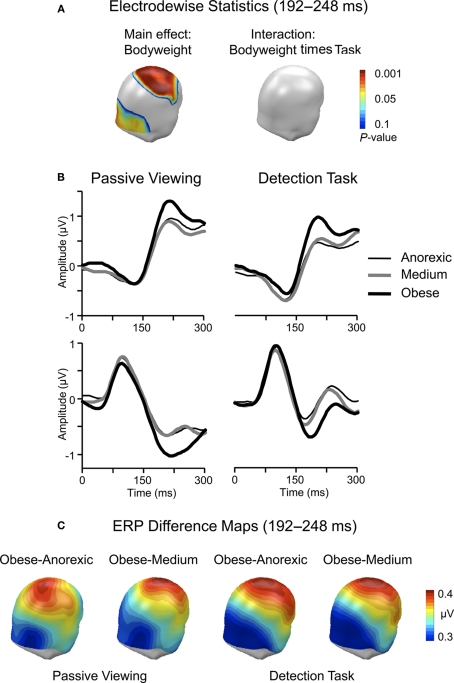
Figure 4.
(A) The outcome of the point-by-point waveform ANOVA is illustrated in terms of P-values, averaged for the purpose of illustration across the time window from 192 to 248 ms. (B) Illustration of the ERP waveforms to anorexic, medium, and obese body drawings during passive viewing and active task conditions for representative right central (#132) and occipito-temporal (#175) sensors. (C) Illustration of the topographical distribution of the original scalp potentials. A back view of a model head is displayed.

