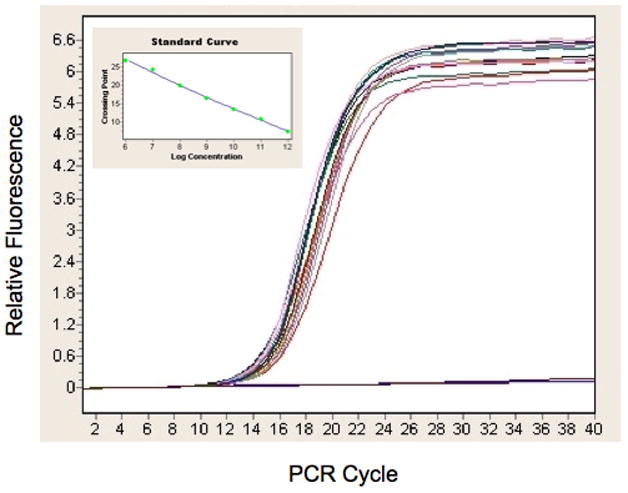
Figure 2.

Quantitation of recombinant baculovirus. The evolution of fluorescent signal is plotted against the cycle number in a quantitative polymerase chain reaction assay using genomes purified from recombinant baculovirus as template. The inset is the standard curve based on DNAs of known concentration that was used for absolute quantification of this data to arrive at titers in genomes per mL for the virus samples. The data shown are for the P0 virus from the YFP validation constructs.
