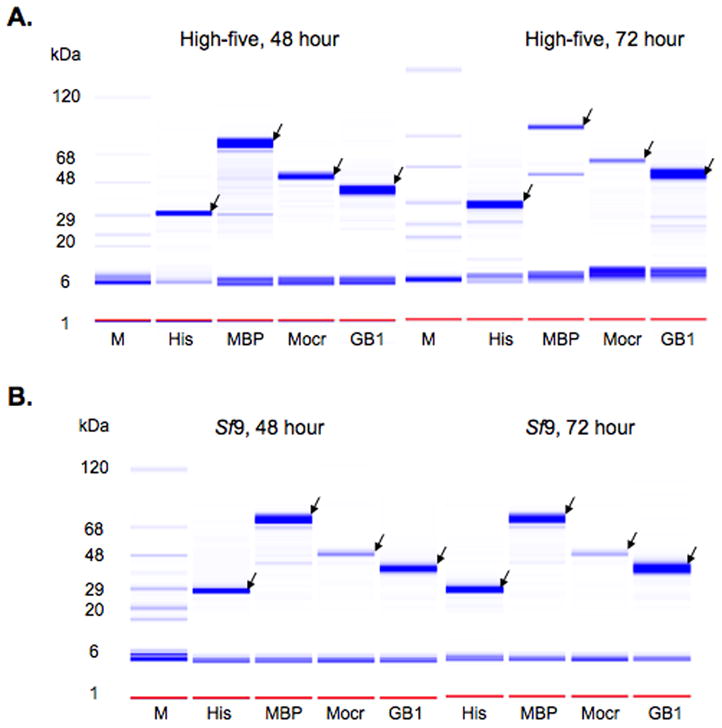
Figure 3.

Intracellular production of YFP as a function of cell type, time and fusion partner. YFP fusions produced in High-five cells (A) and Sf9 cells (B) at were analyzed at 48 and 72 hour timepoints using the Labchip 90. The data are shown as a gel representation similar to SDS-PAGE stained with Coomassie blue. Lane M is the molecular weight marker, the fusion partners are indicated at the bottom of each lane. The arrows indicate proteins at the expected molecular weights.
