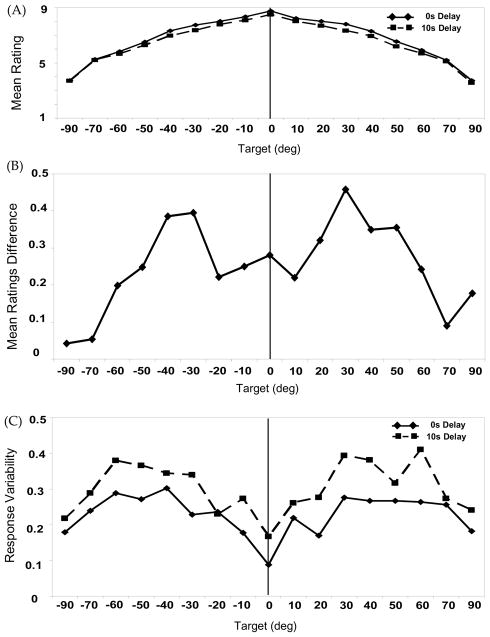
Figure 3.
Experiment 1 Ratings results: (A) Mean ratings for the 0s (solid line) and 10s Delay (dashed line) conditions (B) Reduction in mean “Above” ratings across target locations (0s Delay mean rating −10s Delay mean rating). (C) Mean “Above” ratings variability (SD) for 0s Delay (solid line) and 10s Delay (dashed line) conditions.

