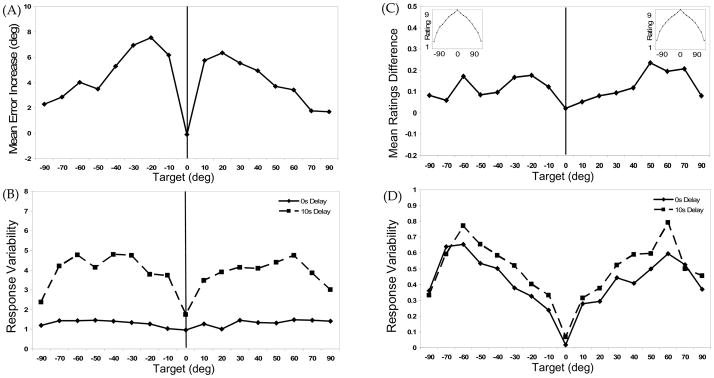
Figure 4.
Experiment 2 results: (A) Increase in mean directional error over delay across target locations for Mouse trials (10s Delay mean error −0s Delay mean error). Positive values indicate error increases in the direction away from the vertical midline axis of the task space (solid vertical line in all figures); (B) Response variability (SD) across target locations for 0s Delay (solid line) and 10s Delay (dashed line) Mouse trials; (C) Reduction in mean “Above” ratings across target locations (0s Delay mean rating −10s Delay mean rating). The insets shows the prototypical ratings gradient obtained in the 0s Delay condition for the Ratings First (left) and the Mouse First (right) conditions; (D) Mean “Above” response variability (SD) for 0s Delay (solid line) and 10s Delay (dashed line) conditions.

