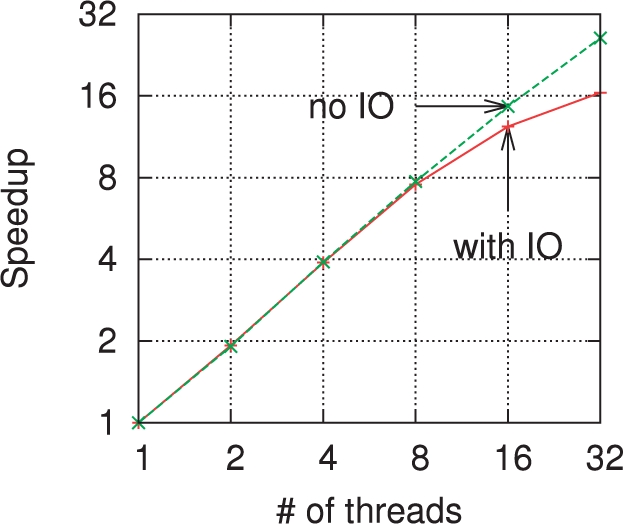
Fig. 4.

Speedup versus number of threads on coverage 5× of the Turkey reads. On this log–log scale plot, a perfectly linear speedup would correspond to a diagonal line. The ‘no IO’ curves includes only the initialization and counting phase times. The curve marked ‘with IO’ counts the total runtime.
