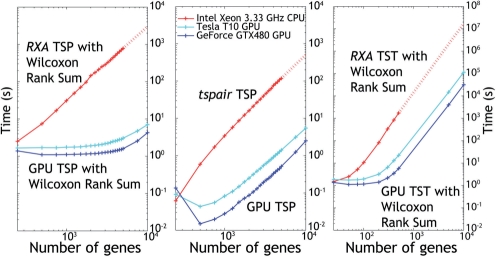
Fig. 2.
Plot of RXA TSP algorithm versus GPU implementation (left). Both algorithms filter for most differentially expressed genes using the Wilcoxon rank-sum test. Maximum speedup is 255X (Tesla T10) and 455X (GTX480). Plot of tspair TSP algorithm versus GPU implementation. Maximum speedup is 83X (Tesla T10) and 228X (GTX480) (center). Plot of RXA TST algorithm versus GPU implementation. Maximum speedup is 77X (Tesla T10) and 301X (GTX480) (right). The dataset used had 350 samples in Class 1 and 306 samples in Class 2. All data points are the mean of three independent runs of the software. Dotted lines indicate extrapolation from previous data points using a quadratic (TSP) or cubic (TST) polynomial fit.

