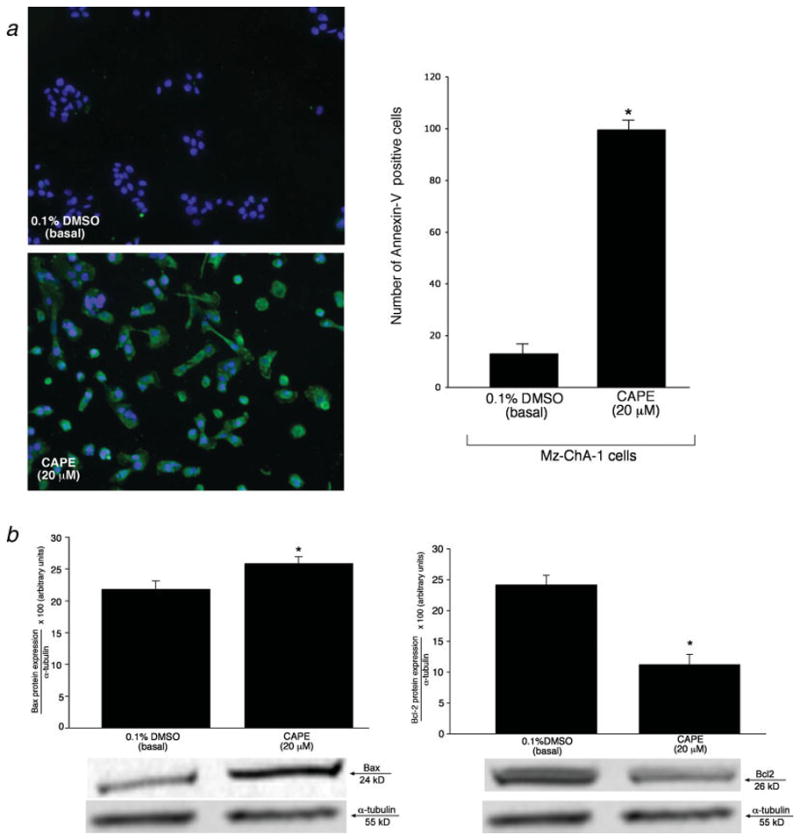
Figure 4.

[a] Evaluation of apoptosis (by Annexin-V staining) in Mz-ChA-1 cells treated with 0.1% DMSO (basal) or CAPE (20 μM) with 0.1% DMSO. There was an approximate 10% positivity in Annexin-V staining in Mz-ChA-1 cells treated with 0.1% DMSO, whereas when cells were stimulated with CAPE there was almost a 100% positive staining for Annexin-V. The number of Annexin-V-positive cells were counted and expressed as a percentage of total cells in 5 random fields for each treatment group. *p<0.01 compared to the corresponding basal value. [b] Immunoblotting analysis for Bax and Bcl-2 in Mz-ChA-1 cells treated with 0.1% DMSO (basal) or CAPE (20 μM, 48 hours) with 0.1% DMSO. CAPE induced an increase in Bax and a decrease in Bcl-2 protein expression compared to Mz-ChA-1 cells stimulated with 0.1% DMSO (basal). Alpha-tubulin was used as an internal control and no changes were observed with this gene. Data are ± SEM of 6 experiments. *p < 0.05 compared to basal (0.1% DMSO).
