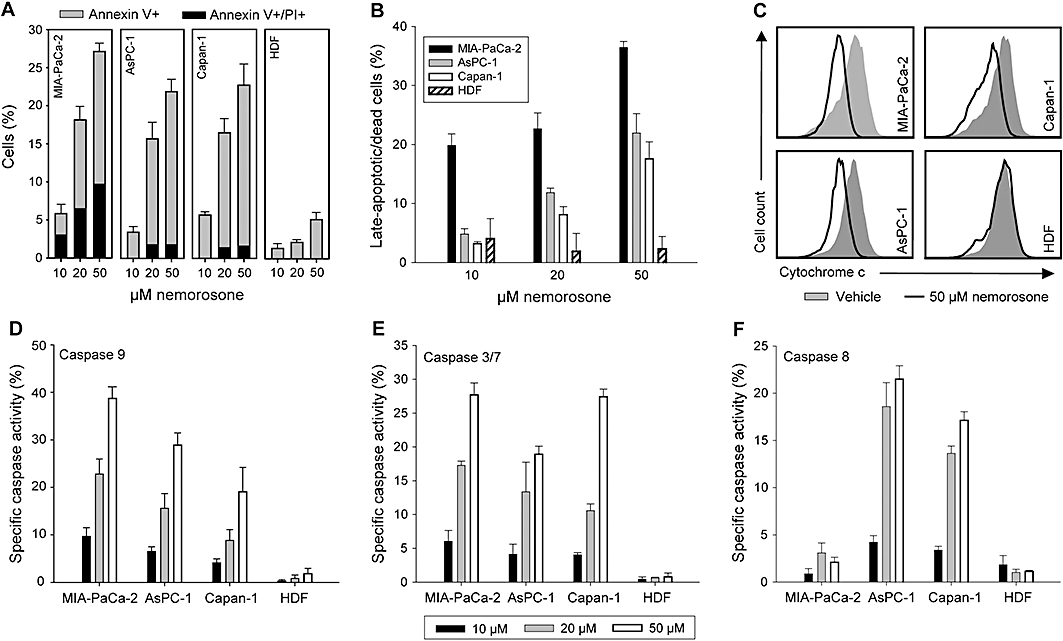
Figure 2.

Analysis of nemorosone-induced apoptosis, cytochrome c release and caspase activation. Cells were treated with the indicated concentrations for 24 h (A) or 48 h (B) before being washed and stained with annexin V and propidium iodide (A) or propidium iodide alone according to the Nicoletti method (B). Percentage of cells demonstrating nemorosone-specific early (annexin V+) and late (PI+) apoptosis is shown. (C) Cytochrome c release was measured by flow-cytometry after treatment with 50 µM nemorosone or vehicle for 24 h. (D–E) Percentage of cells demonstrating nemorosone-specific activation of caspases 9, 3/7 and 8 after treatment with the indicated concentrations for 24 h. Values are mean ± SD of three independent experiments. HDF, human dermal fibroblasts.
