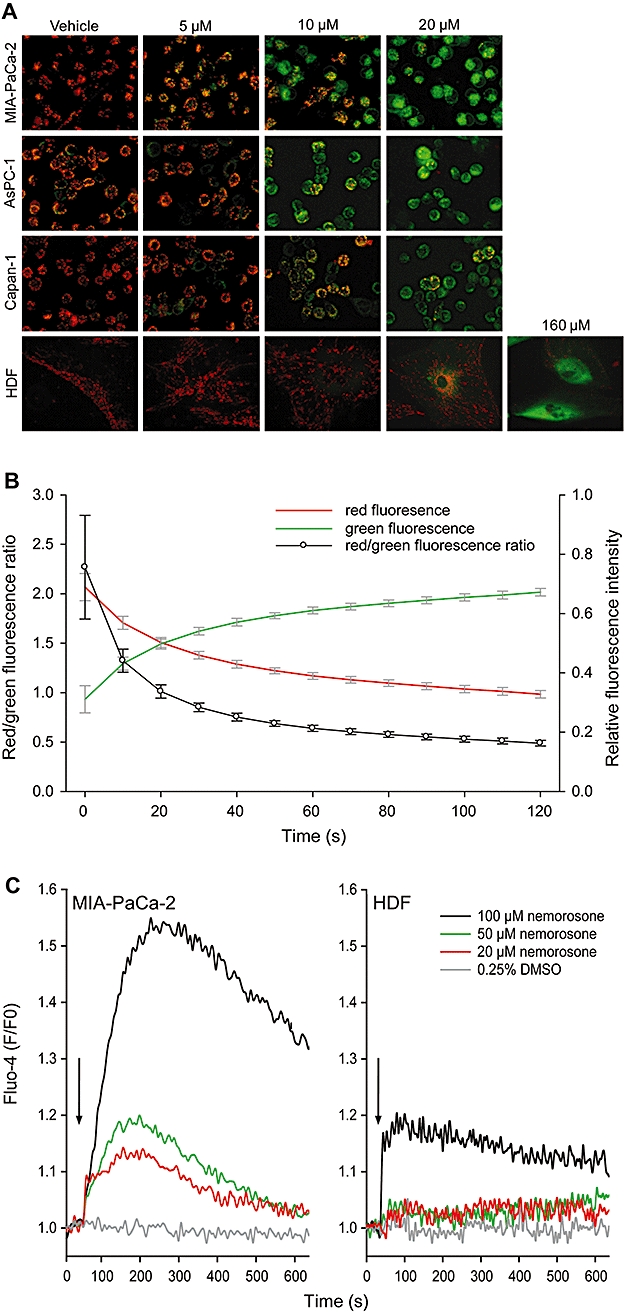
Figure 3.

Analysis of effects of nemorosone on mitochondrial membrane potential ΔΨm and cytosolic calcium concentration [Ca2+]c in pancreatic cancer cells and fibroblasts. (A) Cells were treated with the indicated concentrations of nemorosone or vehicle for 4 h and stained with the voltage-dependent dye JC-1 prior to fluorescence microscopy. Intact mitochondria fluoresce red while cells with atteunuated mitochondrial membrane potential ΔΨm exhibit cytosolic green fluorescence. Images are representative of three independent experiments with similar results. (B) Kinetic analysis of ΔΨm upon nemorosone treatment. Cells were prestained with JC-1 and subsequently treated with 20 µM nemorosone. Fluorescent images were recorded every 10 s after onset of treatment. Development of relative red and green fluorescence as well as red/green fluorescence ratio is shown as mean ± SD of three independent experiments. (C) Analysis of nemorosone-induced changes in cytosolic calcium concentration [Ca2+]c in MIA-PaCa-2 cells and human dermal fibroblasts (HDF). Cells were loaded with the calcium-sensitive Fluo-4 dye and subsequently treated with the indicated concentrations of nemorosone or vehicle after recording a baseline for 30 s (black arrows). Development of Fluo-4 fluorescence relative to baseline fluorescence (F/F0) is shown as mean of three independent experiments. DMSO, dimethylsulphoxide.
