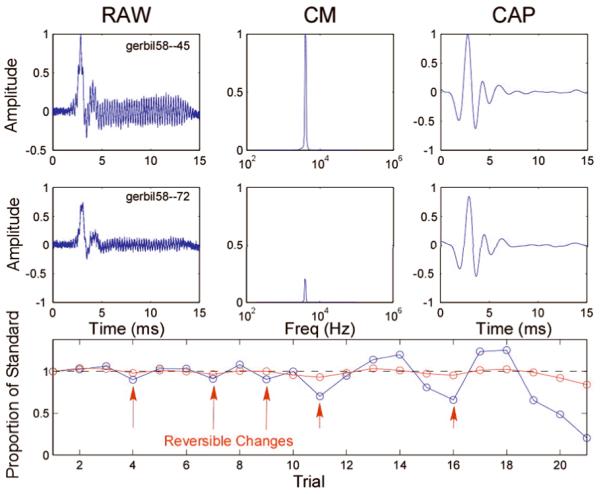
Figure 2.

Screenshot of our near real-time recording set-up in gerbil # 58. The top row shows the “standard” or reference recording, obtained at the cochleostomy, or if there had been little change during the penetration, at a depth near where changes first were observed. Shown are the raw averaged response (left), the Fourier spectral magnitude of the CM (middle), and the raw waveform filtered to observe the CAP (right). The middle row represents these same measurements later in the experiment. In this case, it is evident that the magnitudes of the CM and CAP were considerably reduced compared to the standard measurement. The bottom row is a representation of the sequential progress of the experiment, with the abscissa representing the record number and the ordinate the amplitude of the response relative to the standard. The track thus corresponds to time rather than insertion depth, as the electrode was sometimes advanced and sometimes withdrawn to test for reversibility. Examples of reversible changes in the CM (blue) are indicated by arrows. As shown, the data processing software allowed for on-line visualization of the CM and CAP amplitudes and their progression over the course of the experiment. The recording time for each record was ~ 4 seconds, providing almost real-time feedback of the time course of acoustically evoked intracochlear potentials. Once the electrode was close to the OSL or BM (according to the micro endoscopic image), it could be advanced in steps as small as 5 μm to observe reversible changes.
