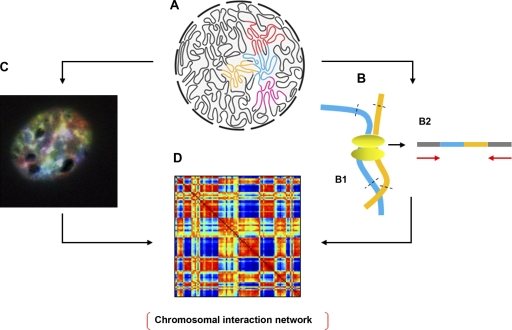
Figure 2.
Methods for exploring the 3D genome. (A) A schematic representation of the 3D genome (courtesy of J. Dekker and N.L. van Berkum, University of Massachusetts Medical School, Worcester, MA). (B) The Hi-C technique. (B1) DNA is cross-linked and digested with restriction enzymes. (B2) High throughput sequencing (8.5 million reads) is used to determine the spatial proximity of sequences, including those on the same or different chromosomes using paired-end sequencing. (C) Image of a murine hematopoietic progenitor interphase nucleus labeled by SKY. All chromosomes are labeled with a unique color to visualize their territories. (D) Once algorithms are developed to characterize the spatial relationships among all CTs in the interphase nucleus simultaneously from SKY data, spatial proximity maps can be generated that integrate both SKY and Hi-C data to more precisely define inter- and intrachromosomal interactions.

