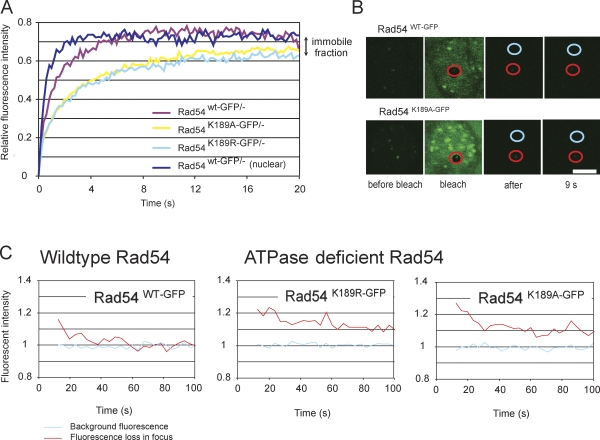
Figure 4.
Photobleaching analysis of Rad54 in foci. (A) Spot-FRAP analysis of Rad54 in foci. A small square containing an individual Rad54 focus was bleached and monitored for fluorescence recovery for each indicated genotype (n = 35). As a control, the fluorescence recovery of non–foci-associated nuclear Rad54 was quantitated (dark blue line). (B) Visualization of iFRAP analysis of Rad54 in foci. The whole cell was bleached excluding a small circular area containing an individual Rad54 focus (red circle). Fluorescence depletion of the nonbleached focus was monitored and compared with the fluorescence level of an unbleached region without a focus (blue circle) for Rad54wt-GFP and Rad54K189A-GFP. Shown here are four frames: before, during, directly after, and 9 s after bleaching. Bar, 5 µm. (C) Quantification of the iFRAP experiment described in B. Graphs represent the fluorescent depletion over time and are based on five individual cells.

