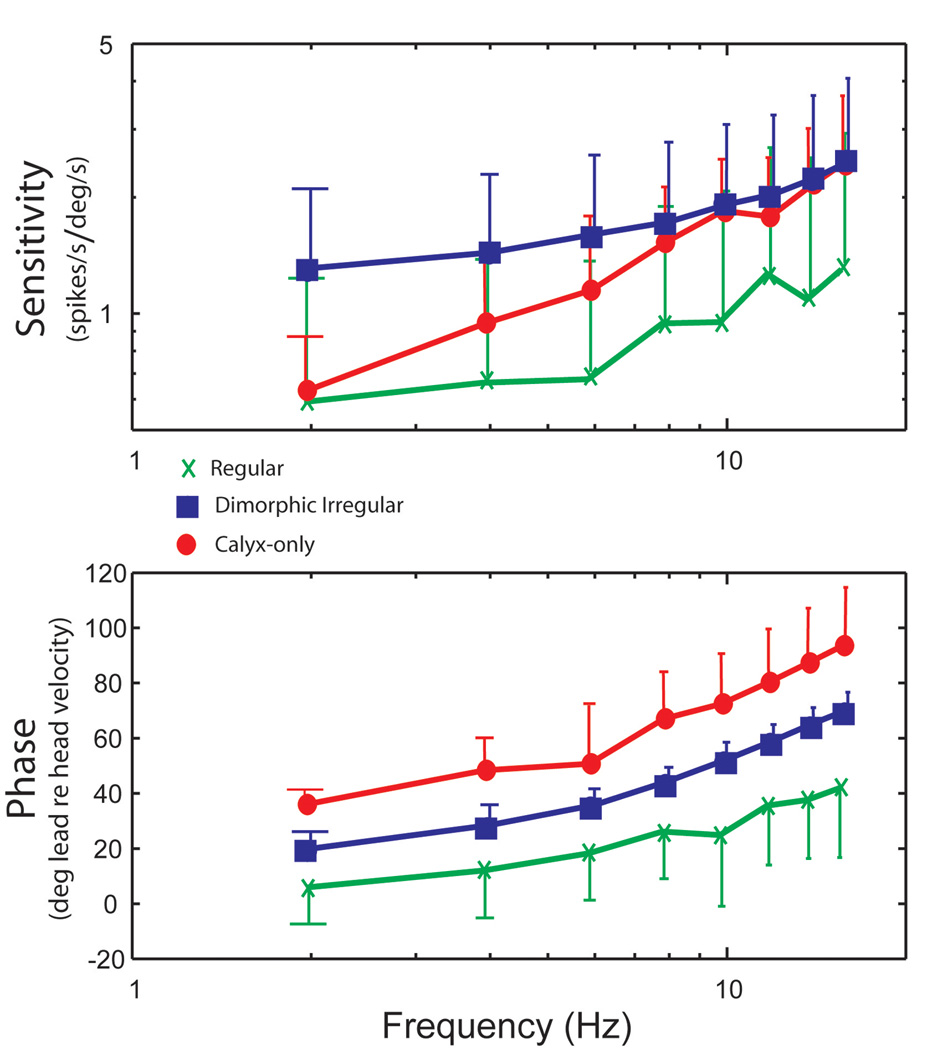
Figure 10.
Average sensitivities and phases of regular afferents (n = 14,  ), high-gain irregular afferents (n = 9,
  ), and low-gain irregular afferents (n = 7,
  ) measured from sinusoidal rotations. Top: sensitivity (spikes/s per deg/s); bottom: phase (deg lead relative to head velocity). Error bars represent mean gain ± 1 SD. Only one bar is shown for clarity. Note that the average responses of low-gain irregular afferents rise to match those of high-gain irregular afferents at high frequencies. This figure was adapted with permission from [15].

