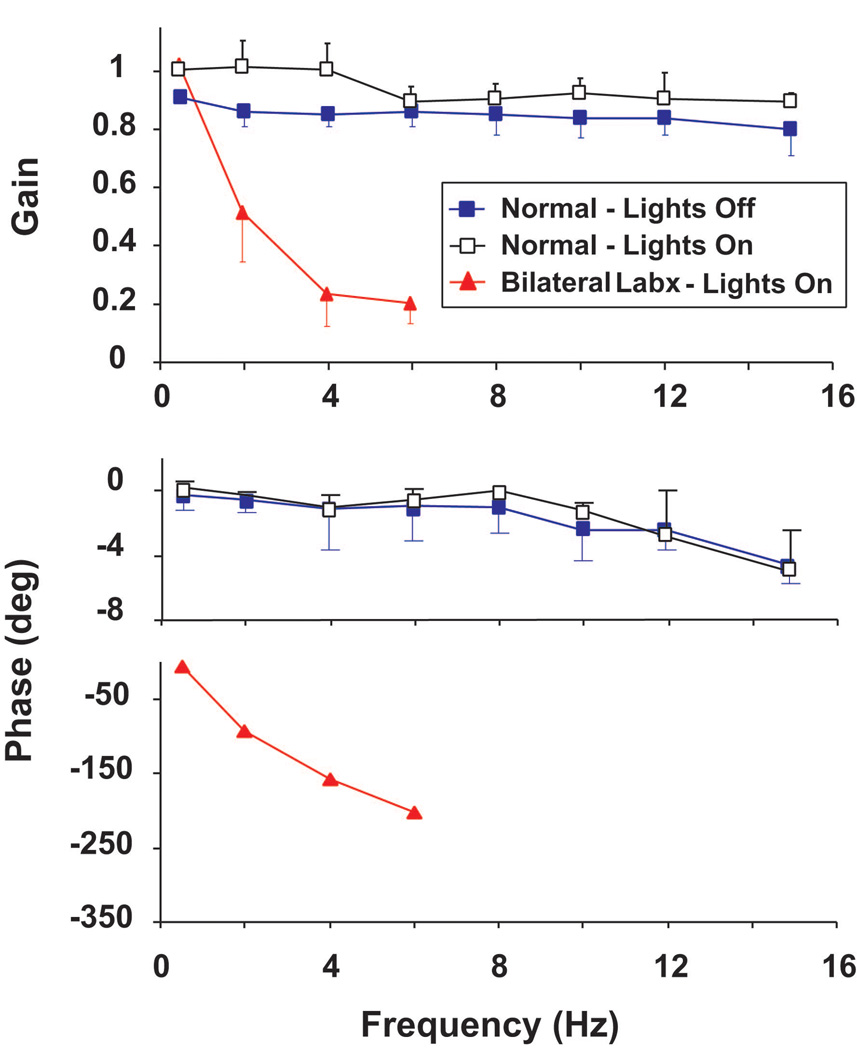
Figure 3.
The average gain and phase plots of responses to 0.5- to 15-Hz rotations given in darkness and in light, ±20°/s for 5 squirrel monkeys. Also included are data from one animal rotated in the light after bilateral labyrinthectomy. In this and all other figures for gain and phase data, error bars show ±1 SD. Error bars for the phase data in the animal tested after bilateral labyrinthectomy are not visible because of their small size relative to the scale of the phase. This figure was adapted with permission from [25].

