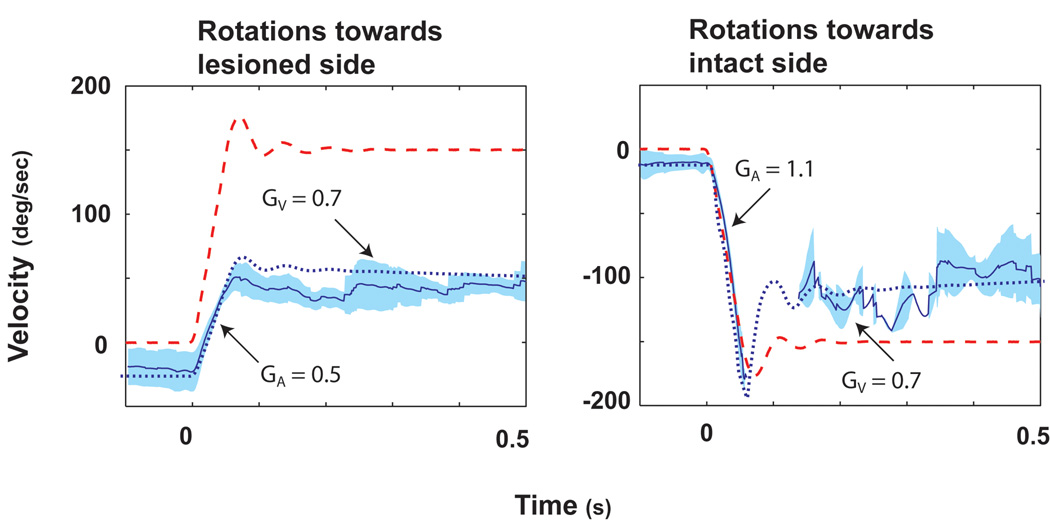
Figure 6.
The average eye and head velocity responses for ispi- (A) and contralesional (B) rotations on day 10 (the animal had been returned to light on day 4) after a unilateral labyrinthectomy. Data in Fig. 5 and Fig. 6 were from the same squirrel monkey. Head velocity is indicated by the dashed red line and eye velocity by the solid blue line. One standard deviation is indicated by the light blue shading around this line. The dotted blue line is the simulated eye response calculated from our bilateral model. Changes in gain due to compensation were simulated by increasing the gain of GP by x2.5 and GT by x1.6. In addition, a first-order band-pass filter, represented by a single pole (0.02 s) and a single zero (0.01 s) were added to the tonic pathway. This figure was adapted with permission from [20].

