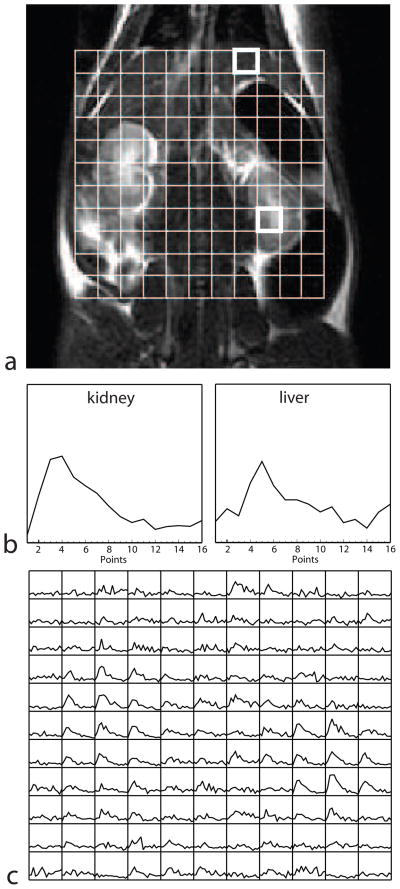
Figure 6.
Data showing lactate dynamics in different tissues of the rat model. (a) A grid showing the arrangement of the 5 × 5 × 5 mm voxels is overlaid on the anatomical (proton) image. (b) Lactate signal at each 5 s time-point is shown for kidney and liver tissue. The time courses are from the upper and lower voxels highlighted in (a), respectively. (c) The lactate time-courses from all the voxels in the grid show different lactate metabolism in different tissues (each grid element shows the lactate signal as a function of time).

