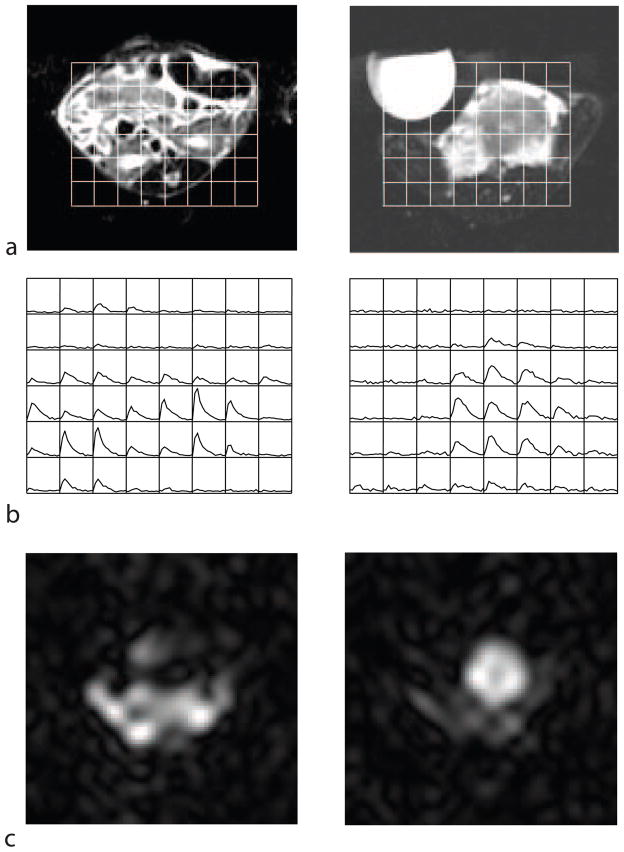
Figure 7.
Measurements of lactate dynamics in the TRAMP mouse model. (a) The voxel (3 × 3 × 4 mm) locations for the 13C data are shown overlaid on an axial proton image through two slices, through the abdomen of the mouse (left) and through the tumour (right). (b) The time-course of the 13C lactate produced in each voxel (each grid element shows the lactate signal as a function of time). (c) The lactate image taken at the 5th timepoint. The syringe seen to the left of the tumour in (a) contained a 13C-lactate reference, but this signal was below the noise floor of this rapid scan. The signal seen outside the abdomen is likely a combination of noise, Gibbs ringing, and artifact due to the lactate signal changing during the volume acquisition.

