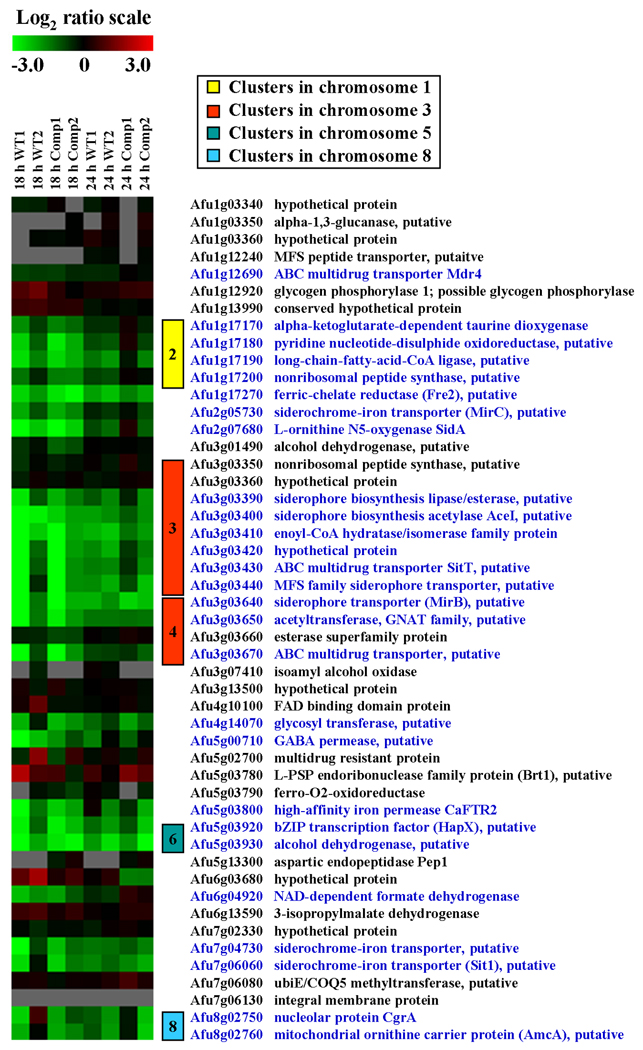
Fig. 4.
Cluster analysis of SreA-responsive gene expression in the ΔacuM mutant. Microarray data comparing the response of the ΔacuM mutant with Af293 (WT) and the ΔacuM∷acuM complemented strain (Comp) after 18 and 24 h incubation in RPMI 1640 medium at 37°C are shown. The bar at the top indicates the colors that correspond to the observed expression ratios. The genes are displayed in the order of their chromosomal location and the vertical colored boxes indicate gene clusters. The numbers in these boxes correspond to the SreA-responsive gene clusters in (Schrettl et al., 2008). The gene names in blue font denote genes that had significantly reduced transcript levels in the ΔacuM mutant compared to the control strains.

