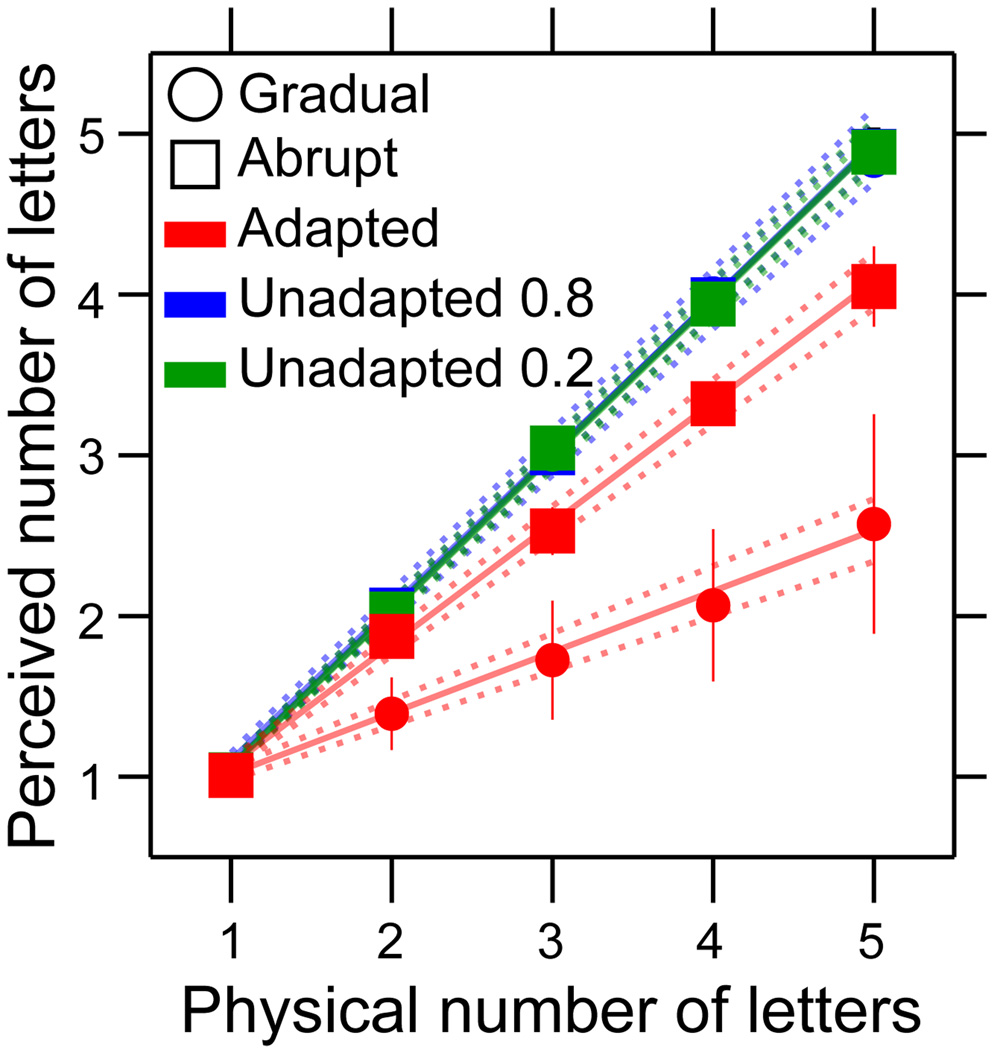
Figure 2. Physical versus perceived number of letters in identification experiment.
The physical versus perceived number of letters in the display, for stimuli presented in gradual (circles) and abrupt (squares) temporal windows in adapted (red), unadapted with 0.8 contrast flankers (blue) and unadapted with 0.2 contrast flankers (green) conditions. Data points show the mean number reported across four observers, error bars show +/− 1 SEM. The points in each condition have been fitted with a linear regression (solid lines); the 95% confidence limits on slope estimates are shown by the dashed lines. After adaptation, participants perceived fewer letters in the display, particularly in the gradual condition.

